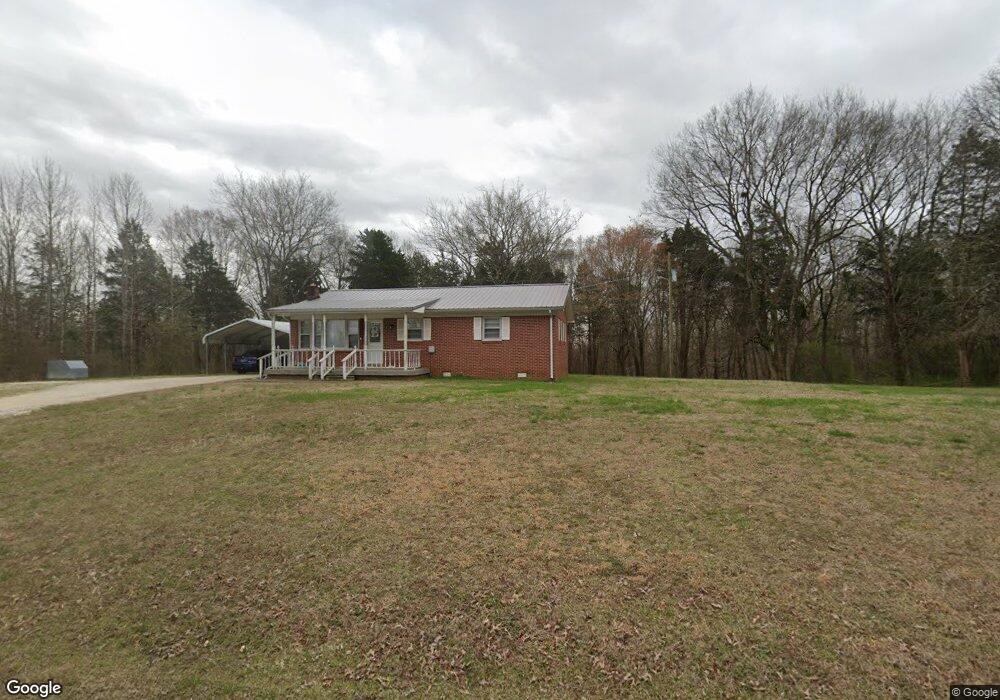
130 Sandy Point Ln Camden, TN 38320
Estimated Value: $104,000 - $154,000
--
Bed
1
Bath
1,148
Sq Ft
$116/Sq Ft
Est. Value
About This Home
This home is located at 130 Sandy Point Ln, Camden, TN 38320 and is currently estimated at $132,615, approximately $115 per square foot. 130 Sandy Point Ln is a home located in Benton County with nearby schools including Camden Elementary School, Briarwood School, and Camden Junior High School.
Ownership History
Date
Name
Owned For
Owner Type
Purchase Details
Closed on
Dec 13, 2023
Sold by
Clayton Christopher R and Clayton Neysa R
Bought by
Berry Loghan W
Current Estimated Value
Home Financials for this Owner
Home Financials are based on the most recent Mortgage that was taken out on this home.
Original Mortgage
$130,099
Outstanding Balance
$128,045
Interest Rate
7.76%
Mortgage Type
FHA
Estimated Equity
$4,570
Purchase Details
Closed on
Mar 8, 2011
Sold by
Clayton Christopher R
Bought by
Clayton Neysa R
Purchase Details
Closed on
Jun 20, 2000
Bought by
Clayton Christopher
Purchase Details
Closed on
Aug 5, 1999
Bought by
Clayton Margie
Purchase Details
Closed on
Mar 17, 1999
Bought by
Hollingsworth M C M and Hollingsworth Rita
Purchase Details
Closed on
Dec 14, 1991
Bought by
Webb William S and Webb Baker Betty J
Create a Home Valuation Report for This Property
The Home Valuation Report is an in-depth analysis detailing your home's value as well as a comparison with similar homes in the area
Home Values in the Area
Average Home Value in this Area
Purchase History
| Date | Buyer | Sale Price | Title Company |
|---|---|---|---|
| Berry Loghan W | $132,500 | None Listed On Document | |
| Clayton Neysa R | -- | -- | |
| Clayton Christopher | $57,000 | -- | |
| Clayton Margie | $17,300 | -- | |
| Hollingsworth M C M | $7,000 | -- | |
| Webb William S | $7,000 | -- |
Source: Public Records
Mortgage History
| Date | Status | Borrower | Loan Amount |
|---|---|---|---|
| Open | Berry Loghan W | $130,099 |
Source: Public Records
Tax History Compared to Growth
Tax History
| Year | Tax Paid | Tax Assessment Tax Assessment Total Assessment is a certain percentage of the fair market value that is determined by local assessors to be the total taxable value of land and additions on the property. | Land | Improvement |
|---|---|---|---|---|
| 2024 | $356 | $13,050 | $875 | $12,175 |
| 2023 | $356 | $13,050 | $875 | $12,175 |
| 2022 | $353 | $12,925 | $875 | $12,050 |
| 2021 | $353 | $12,925 | $875 | $12,050 |
| 2020 | $353 | $12,925 | $875 | $12,050 |
| 2019 | $381 | $12,900 | $875 | $12,025 |
| 2018 | $381 | $12,900 | $875 | $12,025 |
| 2017 | $381 | $12,900 | $875 | $12,025 |
| 2016 | $381 | $12,900 | $875 | $12,025 |
| 2015 | $386 | $12,900 | $875 | $12,025 |
| 2014 | $364 | $12,900 | $875 | $12,025 |
| 2013 | $364 | $12,382 | $0 | $0 |
Source: Public Records
Map
Nearby Homes
- 2642 Mount Carmel Rd
- 65 Sandy Point Rd
- 3150 Highway 70 W
- 0 Firetower Rd
- 4589 Mount Carmel Rd
- 217 Sunnyfield Ln
- 1905 Post Oak Rd
- 435 Bills Dr
- 3295 Mount Carmel Rd
- 335 Mount Carmel Rd
- 6010 Highway 70 W
- 0 Oak Hill Cir
- 1 Post Oak Rd
- 103 Highway 641 N
- 77 Highway 641 S
- 1487 Natchez Trace Rd
- 166 Westview St
- 180 Post Oak Ave
- 144 Post Oak Ave
- 0 Sawyers Mill Rd
- 180 Sandy Point Ln
- 680 Sandy Point Rd
- 73 Sandy Point Ln
- 668 Sandy Point Rd
- 120 Mission Rock Ln
- 560 Sandy Point Rd
- 565 Sandy Point Rd
- 3240 Mount Carmel Rd
- 440 Sandy Point Rd
- 445 Sandy Point Rd
- 3320 Mount Carmel Rd
- 365 Sandy Point Rd
- 330 Sandy Point Rd
- 2732 Mount Carmel Rd
- 210 Bradford Rd
- 300 Sandy Point Rd
- 247 Firetower Rd
- 2544 Mount Carmel Rd
- 225 Sandy Point Rd
- 3540 Mount Carmel Rd