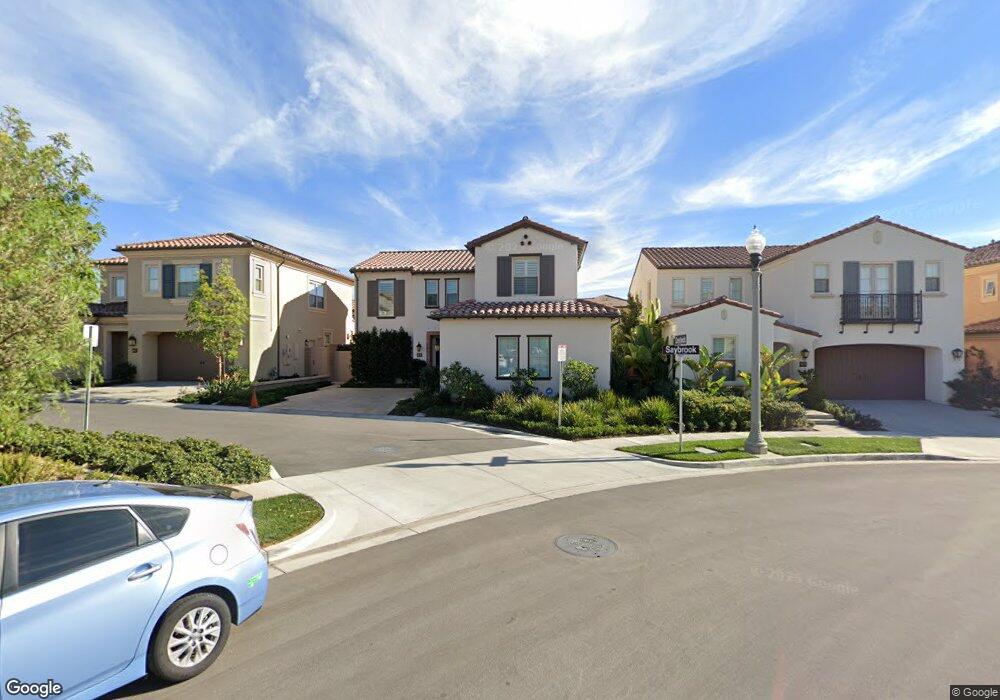
130 Saybrook Irvine, CA 92620
Woodbury and Stonegate NeighborhoodEstimated Value: $2,320,399 - $2,508,000
4
Beds
4
Baths
2,523
Sq Ft
$955/Sq Ft
Est. Value
About This Home
This home is located at 130 Saybrook, Irvine, CA 92620 and is currently estimated at $2,409,100, approximately $954 per square foot. 130 Saybrook is a home with nearby schools including Stonegate Elementary School, Sierra Vista Middle School, and Northwood High School.
Ownership History
Date
Name
Owned For
Owner Type
Purchase Details
Closed on
Feb 22, 2022
Sold by
Eich Evan Yuelai
Bought by
Eich Evan Yuelai
Current Estimated Value
Purchase Details
Closed on
Jan 30, 2015
Sold by
Irvine Pacific Lp
Bought by
Song Liqiong
Create a Home Valuation Report for This Property
The Home Valuation Report is an in-depth analysis detailing your home's value as well as a comparison with similar homes in the area
Home Values in the Area
Average Home Value in this Area
Purchase History
| Date | Buyer | Sale Price | Title Company |
|---|---|---|---|
| Eich Evan Yuelai | -- | Accommodation/Courtesy Recordi | |
| Song Liqiong | $1,056,500 | First American Title Company | |
| Song Liaiona | -- | First American Title Company | |
| Irvine Pacific Lp | -- | First American Title Company |
Source: Public Records
Tax History Compared to Growth
Tax History
| Year | Tax Paid | Tax Assessment Tax Assessment Total Assessment is a certain percentage of the fair market value that is determined by local assessors to be the total taxable value of land and additions on the property. | Land | Improvement |
|---|---|---|---|---|
| 2025 | $16,670 | $1,269,608 | $774,646 | $494,962 |
| 2024 | $16,670 | $1,244,714 | $759,457 | $485,257 |
| 2023 | $16,388 | $1,220,308 | $744,565 | $475,743 |
| 2022 | $16,143 | $1,196,381 | $729,966 | $466,415 |
| 2021 | $15,894 | $1,172,923 | $715,653 | $457,270 |
| 2020 | $16,264 | $1,160,897 | $708,315 | $452,582 |
| 2019 | $16,205 | $1,138,135 | $694,427 | $443,708 |
| 2018 | $16,067 | $1,115,819 | $680,811 | $435,008 |
| 2017 | $15,834 | $1,093,941 | $667,462 | $426,479 |
| 2016 | $15,341 | $1,072,492 | $654,375 | $418,117 |
| 2015 | $4,334 | $1,488 | $1,488 | $0 |
| 2014 | -- | $1,459 | $1,459 | $0 |
Source: Public Records
Map
Nearby Homes