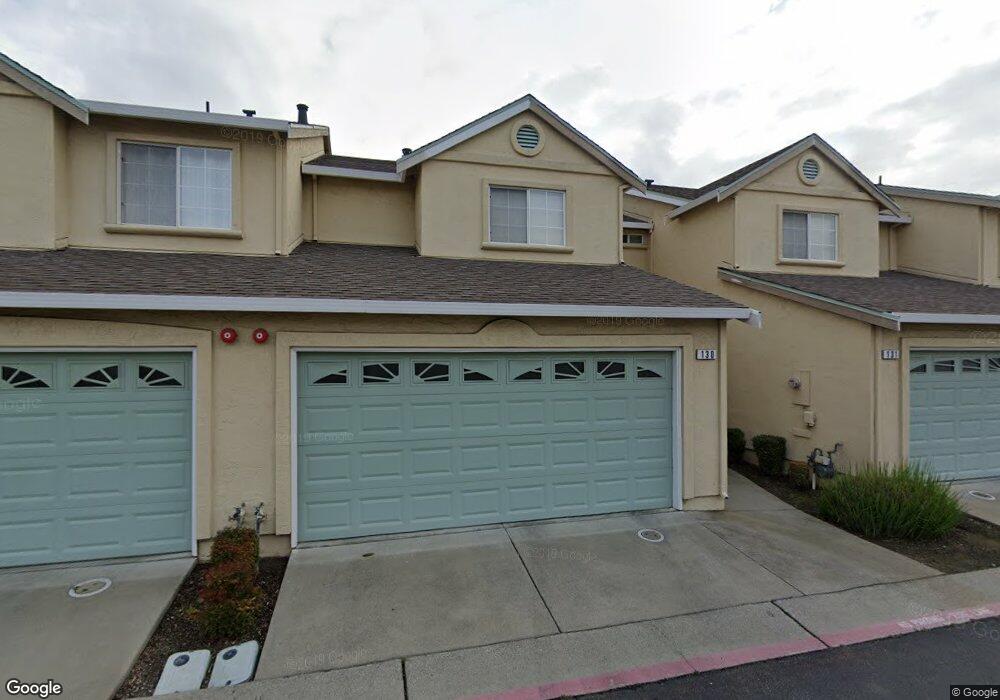
130 Sutherlin Ln Fairfield, CA 94534
Estimated Value: $434,108 - $511,000
2
Beds
3
Baths
1,240
Sq Ft
$379/Sq Ft
Est. Value
About This Home
This home is located at 130 Sutherlin Ln, Fairfield, CA 94534 and is currently estimated at $469,527, approximately $378 per square foot. 130 Sutherlin Ln is a home located in Solano County with nearby schools including K. I. Jones Elementary School, Angelo Rodriguez High School, and Solano Christian Academy.
Ownership History
Date
Name
Owned For
Owner Type
Purchase Details
Closed on
Apr 21, 2017
Sold by
Vanhorst Jeannie Anne
Bought by
Conner Rochelle and Petersen Joel
Current Estimated Value
Home Financials for this Owner
Home Financials are based on the most recent Mortgage that was taken out on this home.
Original Mortgage
$295,000
Outstanding Balance
$246,087
Interest Rate
4.3%
Mortgage Type
New Conventional
Estimated Equity
$223,440
Purchase Details
Closed on
Oct 22, 2005
Sold by
Vanhorst Jeannie
Bought by
Vanhorst Jeannie Anne
Purchase Details
Closed on
Mar 25, 1997
Sold by
Solano County Housing Ptnrs I
Bought by
Vanhorst Jeannie
Home Financials for this Owner
Home Financials are based on the most recent Mortgage that was taken out on this home.
Original Mortgage
$61,900
Interest Rate
7.63%
Create a Home Valuation Report for This Property
The Home Valuation Report is an in-depth analysis detailing your home's value as well as a comparison with similar homes in the area
Home Values in the Area
Average Home Value in this Area
Purchase History
| Date | Buyer | Sale Price | Title Company |
|---|---|---|---|
| Conner Rochelle | $330,000 | Fidelity National Title Co | |
| Vanhorst Jeannie Anne | -- | -- | |
| Vanhorst Jeannie | $135,500 | Frontier Title Company |
Source: Public Records
Mortgage History
| Date | Status | Borrower | Loan Amount |
|---|---|---|---|
| Open | Conner Rochelle | $295,000 | |
| Previous Owner | Vanhorst Jeannie | $61,900 | |
| Closed | Vanhorst Jeannie | $45,500 |
Source: Public Records
Tax History Compared to Growth
Tax History
| Year | Tax Paid | Tax Assessment Tax Assessment Total Assessment is a certain percentage of the fair market value that is determined by local assessors to be the total taxable value of land and additions on the property. | Land | Improvement |
|---|---|---|---|---|
| 2025 | $4,205 | $382,988 | $92,842 | $290,146 |
| 2024 | $4,205 | $375,479 | $91,022 | $284,457 |
| 2023 | $4,075 | $368,118 | $89,238 | $278,880 |
| 2022 | $4,061 | $360,901 | $87,490 | $273,411 |
| 2021 | $4,019 | $353,825 | $85,775 | $268,050 |
| 2020 | $4,086 | $350,198 | $84,896 | $265,302 |
| 2019 | $3,989 | $343,332 | $83,232 | $260,100 |
| 2018 | $4,109 | $336,600 | $81,600 | $255,000 |
| 2017 | $2,435 | $189,940 | $42,098 | $147,842 |
| 2016 | $2,412 | $186,217 | $41,273 | $144,944 |
| 2015 | $2,271 | $183,421 | $40,654 | $142,767 |
| 2014 | $2,252 | $179,829 | $39,858 | $139,971 |
Source: Public Records
Map
Nearby Homes
- 2846 Owens St
- 2796 Mankas Blvd
- 3033 Vista Grande
- 1737 Kearny Ct
- 2045 Dorland Dr
- 2695 Vista Linda
- 3114 Lomita Ct
- 2051 Barbour Dr
- 2724 Toland Dr
- 3109 Burbank Dr
- 1737 Alford Dr
- 2635 Alvarado Ct Unit 3
- 2125 Mecca Ct
- 1986 Larchmont Cir
- 2530 Vista Grande
- 2503 China Ct
- 3451 Nantucket Dr
- 2415 Tea Ct
- 3418 Astoria Ct
- 2517 Kingsmill Ln
- 129 Sutherlin Ln
- 131 Sutherlin Ln
- 132 Sutherlin Ln
- 150 Sutherlin Ln
- 128 Ritter Ct
- 125 Southbridge Ln
- 149 Sutherlin Ln
- 148 Sutherlin Ln
- 124 Southbridge Ln
- 147 Sutherlin Ln
- 127 Ritter Ct
- 151 Sutherlin Ln
- 123 Southbridge Ln
- 126 Ritter Ct
- 152 Sutherlin Ln
- 122 Brogan Ct
- 155 Ritter Ct
- 146 Southbridge Ln
- 145 Southbridge Ln
- 133 Southbridge Ln