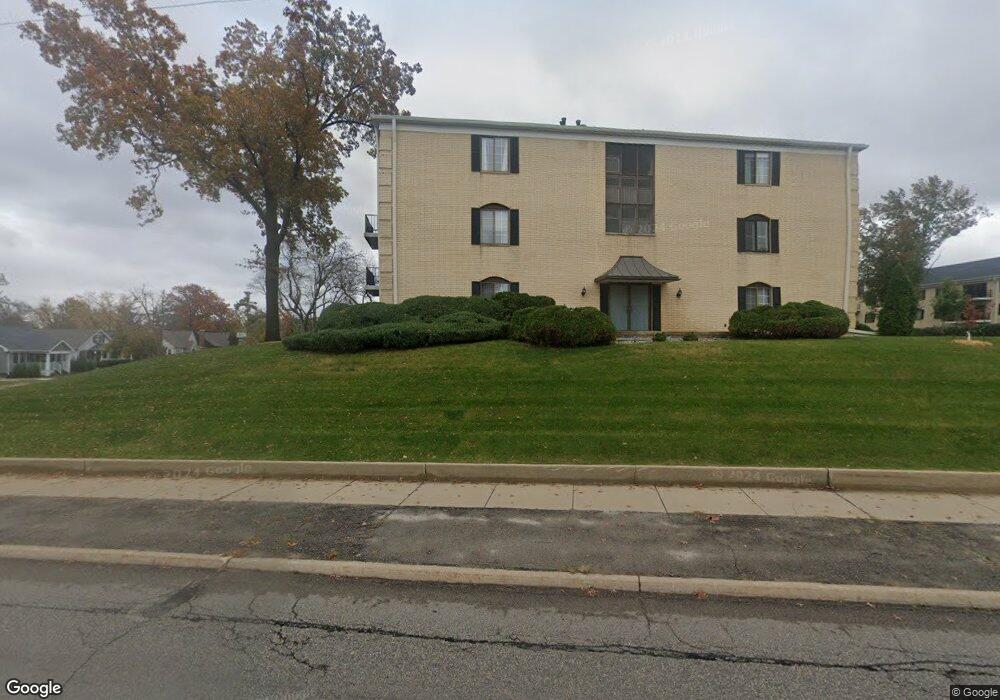
130 Thompson Dr SE Cedar Rapids, IA 52403
Estimated Value: $125,000 - $139,444
2
Beds
2
Baths
1,304
Sq Ft
$99/Sq Ft
Est. Value
About This Home
This home is located at 130 Thompson Dr SE, Cedar Rapids, IA 52403 and is currently estimated at $129,611, approximately $99 per square foot. 130 Thompson Dr SE is a home located in Linn County with nearby schools including Arthur Elementary School, Franklin Middle School, and George Washington High School.
Ownership History
Date
Name
Owned For
Owner Type
Purchase Details
Closed on
Jan 8, 2024
Sold by
Orlich-Healy Maria K
Bought by
Chukas Jason P and Dickey Jennifer
Current Estimated Value
Home Financials for this Owner
Home Financials are based on the most recent Mortgage that was taken out on this home.
Original Mortgage
$45,000
Outstanding Balance
$44,213
Interest Rate
6.95%
Mortgage Type
New Conventional
Estimated Equity
$85,398
Purchase Details
Closed on
Oct 31, 2017
Sold by
Harris Beverly J
Bought by
Healy Richard F and Healy Maria K Orlich
Home Financials for this Owner
Home Financials are based on the most recent Mortgage that was taken out on this home.
Original Mortgage
$7,950
Interest Rate
3.85%
Mortgage Type
Balloon
Create a Home Valuation Report for This Property
The Home Valuation Report is an in-depth analysis detailing your home's value as well as a comparison with similar homes in the area
Home Values in the Area
Average Home Value in this Area
Purchase History
| Date | Buyer | Sale Price | Title Company |
|---|---|---|---|
| Chukas Jason P | $98,000 | None Listed On Document | |
| Chukas Jason P | $98,000 | None Listed On Document | |
| Healy Richard F | $79,500 | None Available |
Source: Public Records
Mortgage History
| Date | Status | Borrower | Loan Amount |
|---|---|---|---|
| Open | Chukas Jason P | $45,000 | |
| Closed | Chukas Jason P | $45,000 | |
| Previous Owner | Healy Richard F | $7,950 | |
| Previous Owner | Healy Richard F | $71,550 |
Source: Public Records
Tax History Compared to Growth
Tax History
| Year | Tax Paid | Tax Assessment Tax Assessment Total Assessment is a certain percentage of the fair market value that is determined by local assessors to be the total taxable value of land and additions on the property. | Land | Improvement |
|---|---|---|---|---|
| 2025 | $2,036 | $126,400 | $19,000 | $107,400 |
| 2024 | $2,230 | $134,100 | $19,000 | $115,100 |
| 2023 | $2,230 | $134,100 | $19,000 | $115,100 |
| 2022 | $2,188 | $118,000 | $19,000 | $99,000 |
| 2021 | $1,484 | $118,000 | $19,000 | $99,000 |
| 2020 | $1,484 | $79,100 | $14,000 | $65,100 |
| 2019 | $1,570 | $84,600 | $14,000 | $70,600 |
| 2018 | $1,760 | $84,600 | $14,000 | $70,600 |
| 2017 | $1,710 | $90,300 | $4,500 | $85,800 |
| 2016 | $1,829 | $89,400 | $4,500 | $84,900 |
| 2015 | $1,847 | $90,089 | $4,500 | $85,589 |
| 2014 | $1,662 | $90,089 | $4,500 | $85,589 |
| 2013 | $1,620 | $90,089 | $4,500 | $85,589 |
Source: Public Records
Map
Nearby Homes
- 130 Thompson Dr SE Unit 320
- 130 Thompson Dr SE Unit 214
- 100 Thompson Dr SE Unit 212
- 100 Thompson Dr SE Unit 320
- 150 Thompson Dr SE Unit 202
- 2321 1st Ave SE
- 127 24th Street Dr SE
- 2222 1st Ave NE Unit 504
- 2222 1st Ave NE
- 2222 1st Ave NE Unit 507
- 2222 1st Ave NE Unit 107
- 2222 1st Ave NE Unit 305
- 2135 1st Ave SE
- 2135 1st Ave SE Unit 215
- 2135 1st Ave SE Unit 217
- 2135 1st Ave SE Unit 125
- 2135 1st Ave SE Unit 115
- 2131 1st Ave SE Unit 310
- 2131 1st Ave SE Unit 108
- 2131 1st Ave SE Unit 116
- 130 Thompson Dr SE Unit 106
- 130 Thompson Dr SE Unit 216
- 130 Thompson Dr SE
- 130 Thompson Dr SE
- 130 Thompson Dr SE
- 130 Thompson Dr SE
- 130 Thompson Dr SE
- 130 Thompson Dr SE
- 130 Thompson Dr SE
- 130 Thompson Dr SE
- 130 Thompson Dr SE
- 130 Thompson Dr SE
- 130 Thompson Dr SE
- 130 Thompson Dr SE Unit 22
- 130 Thompson Dr SE
- 130 Thompson Dr SE
- 130 Thompson Dr SE
- 130 Thompson Dr SE
- 130 Thompson Dr SE
- 130 Thompson Dr SE Unit 208