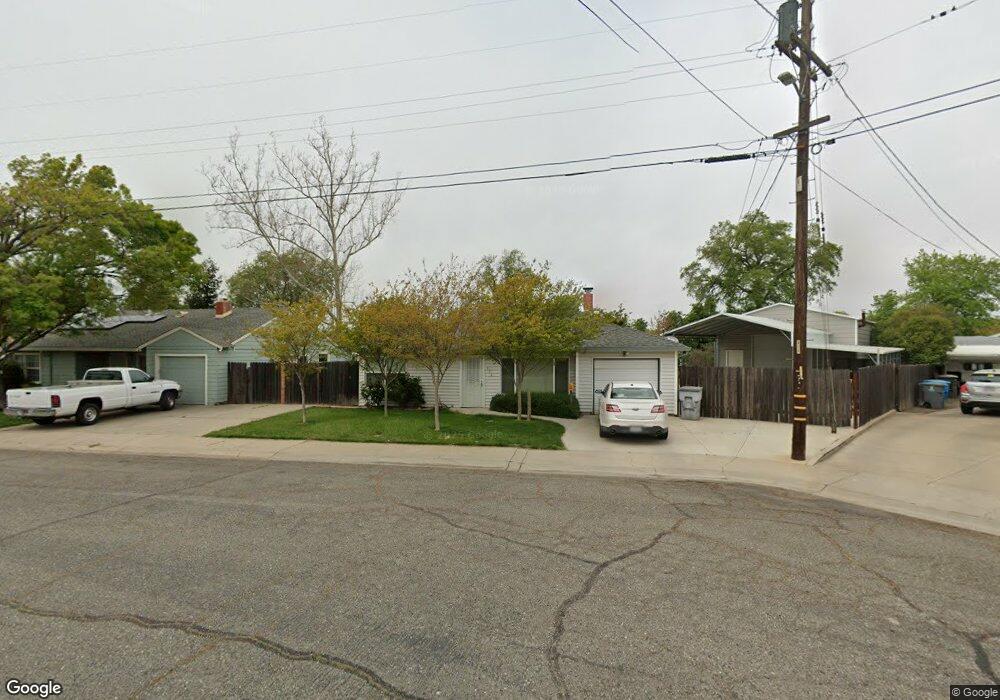
130 Triplett Way Marysville, CA 95901
Estimated Value: $188,000 - $343,000
3
Beds
1
Bath
1,080
Sq Ft
$249/Sq Ft
Est. Value
About This Home
This home is located at 130 Triplett Way, Marysville, CA 95901 and is currently estimated at $269,305, approximately $249 per square foot. 130 Triplett Way is a home located in Yuba County with nearby schools including Kynoch Elementary School, Anna McKenney Intermediate, and Marysville High School.
Ownership History
Date
Name
Owned For
Owner Type
Purchase Details
Closed on
Mar 23, 2016
Sold by
Long Edison
Bought by
Long Edison
Current Estimated Value
Home Financials for this Owner
Home Financials are based on the most recent Mortgage that was taken out on this home.
Original Mortgage
$101,750
Outstanding Balance
$82,484
Interest Rate
4.4%
Mortgage Type
FHA
Estimated Equity
$186,821
Purchase Details
Closed on
Feb 4, 2014
Sold by
Long Sandra
Bought by
Long Edison
Home Financials for this Owner
Home Financials are based on the most recent Mortgage that was taken out on this home.
Original Mortgage
$40,000
Interest Rate
4.38%
Mortgage Type
Unknown
Purchase Details
Closed on
Jan 30, 2014
Sold by
Gorin Sharon L
Bought by
Long Edison
Home Financials for this Owner
Home Financials are based on the most recent Mortgage that was taken out on this home.
Original Mortgage
$40,000
Interest Rate
4.38%
Mortgage Type
Unknown
Create a Home Valuation Report for This Property
The Home Valuation Report is an in-depth analysis detailing your home's value as well as a comparison with similar homes in the area
Home Values in the Area
Average Home Value in this Area
Purchase History
| Date | Buyer | Sale Price | Title Company |
|---|---|---|---|
| Long Edison | -- | Lawyers Title | |
| Long Edison | -- | Old Republic Title Company | |
| Long Edison | $60,000 | North State Title Company |
Source: Public Records
Mortgage History
| Date | Status | Borrower | Loan Amount |
|---|---|---|---|
| Open | Long Edison | $101,750 | |
| Closed | Long Edison | $40,000 |
Source: Public Records
Tax History Compared to Growth
Tax History
| Year | Tax Paid | Tax Assessment Tax Assessment Total Assessment is a certain percentage of the fair market value that is determined by local assessors to be the total taxable value of land and additions on the property. | Land | Improvement |
|---|---|---|---|---|
| 2025 | $826 | $73,540 | $24,511 | $49,029 |
| 2023 | $826 | $70,686 | $23,560 | $47,126 |
| 2022 | $797 | $69,301 | $23,099 | $46,202 |
| 2021 | $786 | $67,944 | $22,647 | $45,297 |
| 2020 | $778 | $67,248 | $22,415 | $44,833 |
| 2019 | $762 | $65,930 | $21,976 | $43,954 |
| 2018 | $746 | $64,639 | $21,546 | $43,093 |
| 2017 | $723 | $63,373 | $21,124 | $42,249 |
| 2016 | $716 | $62,131 | $20,710 | $41,421 |
| 2015 | $700 | $61,198 | $20,399 | $40,799 |
| 2014 | $493 | $35,955 | $8,987 | $26,968 |
Source: Public Records
Map
Nearby Homes
- 154 Triplett Way
- 31 E 24th St
- 2209 Boulton Way
- 2136 Ahern St
- 2225 Bubb St
- 930 Johnson Ave
- 2417 Foust St
- 904 E 22nd St
- 102 E 18th St Unit 3
- 909 E 21st St
- 9080 California 70
- 1431 B St
- 7307 N Roberta Way
- 1147 Johnson Ave
- 308 E 16th St
- 1175 E 22nd St
- 1005 Huston St
- 1231 Johnson Ave
- 1317 Freeman St
- 1603 Ellis Lake Dr
- 124 Triplett Way
- 136 Triplett Way
- 116 Triplett Way
- 142 Triplett Way
- 125 Triplett Way
- 110 Triplett Way
- 148 Triplett Way
- 141 Triplett Way
- 113 Triplett Way
- 104 Triplett Way
- 147 Triplett Way
- 209 Gross Ave
- 131 Gross Ave
- 215 Gross Ave
- 96 Triplett Way
- 221 Gross Ave
- 2526 Sampson St
- 90 Triplett Way
- 2518 Sampson St