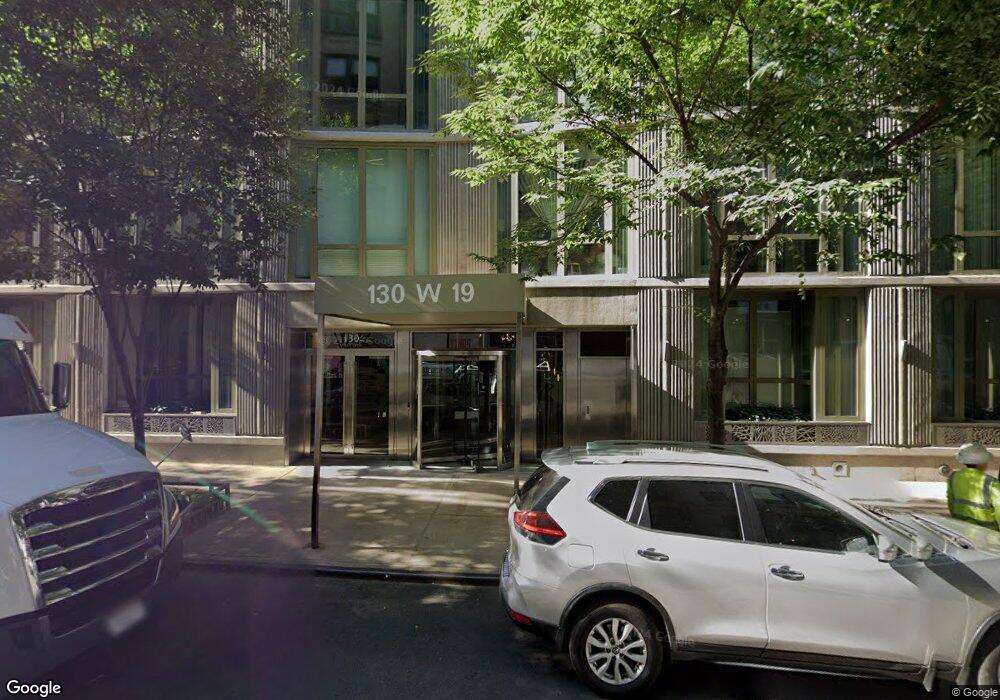
Chelsea House 130 W 19th St Unit 10A New York, NY 10011
Chelsea NeighborhoodEstimated Value: $2,147,000 - $3,364,378
--
Bed
--
Bath
1,728
Sq Ft
$1,637/Sq Ft
Est. Value
About This Home
This home is located at 130 W 19th St Unit 10A, New York, NY 10011 and is currently estimated at $2,829,345, approximately $1,637 per square foot. 130 W 19th St Unit 10A is a home located in New York County with nearby schools including P.S. 11 Sarah J. Garnet School, Clinton School, and Middle School 297.
Ownership History
Date
Name
Owned For
Owner Type
Purchase Details
Closed on
Feb 16, 2012
Sold by
Lee Jenny Wan Ching and Ting Michael Sheng-Yi
Bought by
Smith Jennifer Fisher and Smith Matthew Michael
Current Estimated Value
Home Financials for this Owner
Home Financials are based on the most recent Mortgage that was taken out on this home.
Original Mortgage
$1,187,036
Outstanding Balance
$812,851
Interest Rate
3.88%
Mortgage Type
Purchase Money Mortgage
Estimated Equity
$2,016,494
Purchase Details
Closed on
Sep 17, 2007
Sold by
136 West 19Th Street and % The Clarett Group
Bought by
Lee Jenny Wan Ching and Ting Michael Sheng-Yi
Home Financials for this Owner
Home Financials are based on the most recent Mortgage that was taken out on this home.
Original Mortgage
$1,000,000
Interest Rate
6.65%
Mortgage Type
Purchase Money Mortgage
Create a Home Valuation Report for This Property
The Home Valuation Report is an in-depth analysis detailing your home's value as well as a comparison with similar homes in the area
Home Values in the Area
Average Home Value in this Area
Purchase History
| Date | Buyer | Sale Price | Title Company |
|---|---|---|---|
| Smith Jennifer Fisher | $2,700,000 | -- | |
| Smith Jennifer Fisher | $2,700,000 | -- | |
| Lee Jenny Wan Ching | $2,500,000 | -- | |
| Lee Jenny Wan Ching | $2,500,000 | -- |
Source: Public Records
Mortgage History
| Date | Status | Borrower | Loan Amount |
|---|---|---|---|
| Open | Smith Jennifer Fisher | $1,187,036 | |
| Closed | Smith Jennifer Fisher | $1,187,036 | |
| Previous Owner | Lee Jenny Wan Ching | $500,000 | |
| Previous Owner | Lee Jenny Wan Ching | $1,000,000 |
Source: Public Records
Tax History Compared to Growth
Tax History
| Year | Tax Paid | Tax Assessment Tax Assessment Total Assessment is a certain percentage of the fair market value that is determined by local assessors to be the total taxable value of land and additions on the property. | Land | Improvement |
|---|---|---|---|---|
| 2025 | $43,851 | $347,400 | $15,013 | $332,387 |
| 2024 | $43,851 | $350,755 | $15,013 | $335,742 |
| 2023 | $35,369 | $349,485 | $15,013 | $334,472 |
| 2022 | $35,466 | $351,366 | $15,013 | $336,353 |
| 2021 | $41,084 | $334,912 | $15,013 | $319,899 |
| 2020 | $35,385 | $370,792 | $15,013 | $355,779 |
| 2019 | $33,617 | $362,455 | $15,013 | $347,442 |
| 2018 | $37,668 | $366,619 | $15,013 | $351,606 |
| 2017 | $28,205 | $330,368 | $15,013 | $315,355 |
| 2016 | $27,914 | $322,822 | $15,013 | $307,809 |
| 2015 | $10,737 | $281,347 | $15,013 | $266,334 |
Source: Public Records
About Chelsea House
Map
Nearby Homes
- 130 W 19th St Unit 4E
- 130 W 19th St Unit 4F
- 130 W 19th St Unit 3E
- 130 W 19th St Unit 8D
- 130 W 19th St Unit TOWNHOUSEC
- 139 W 19th St Unit 4NE
- 155 W 18th St Unit 404
- 155 W 18th St Unit 504
- 155 W 18th St Unit 602
- 121 W 19th St Unit PHF
- 130 W 20th St Unit 2B
- 120 W 20th St Unit PH
- 163 W 18th St Unit 3C
- 120 W 18th St Unit 3B
- 143 W 20th St Unit 2SN
- 129 W 20th St Unit 5C
- 165 W 18th St Unit GARDENA
- 117 W 17th St Unit PH6A
- 121 W 20th St Unit 2D
- 155 W 20th St Unit 6 J
- 130 W 19th St
- 130 W 19th St Unit PH2A
- 130 W 19th St Unit PH1A
- 130 W 19th St Unit 12D
- 130 W 19th St Unit 12C
- 130 W 19th St Unit 12B
- 130 W 19th St Unit 12A
- 130 W 19th St Unit 11D
- 130 W 19th St Unit 11C
- 130 W 19th St Unit 11B
- 130 W 19th St Unit 11A
- 130 W 19th St Unit 10D
- 130 W 19th St Unit 10C
- 130 W 19th St Unit 10B
- 130 W 19th St Unit 9F
- 130 W 19th St Unit 9E
- 130 W 19th St Unit 9D
- 130 W 19th St Unit 9C
- 130 W 19th St Unit 9B
- 130 W 19th St Unit 9A