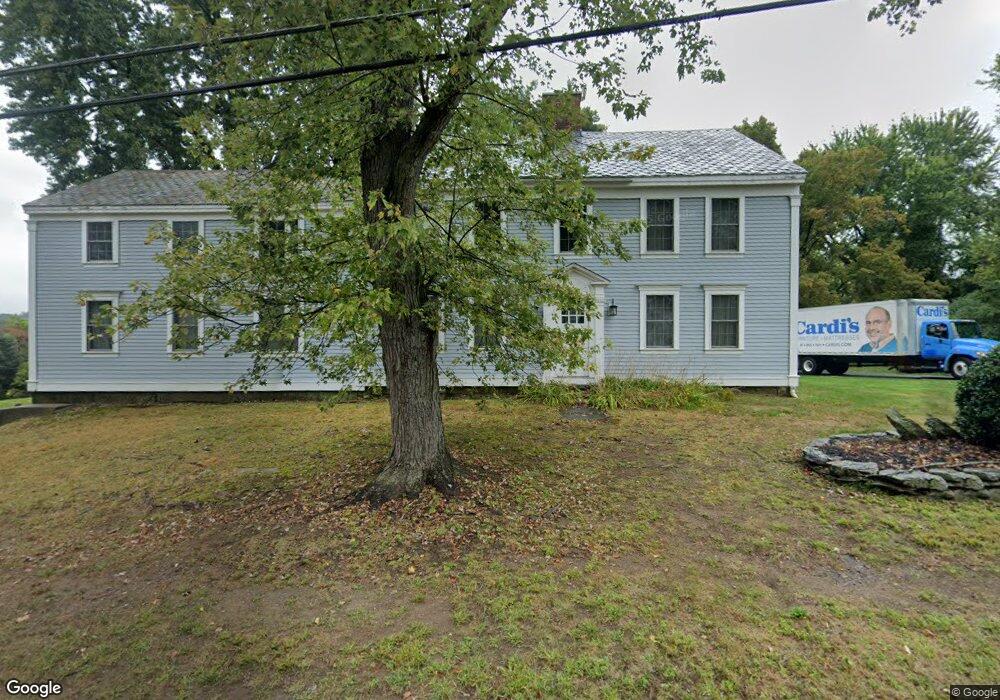
130 West St Unit Lot 0 Granby, MA 01033
Estimated Value: $728,000 - $820,000
4
Beds
3
Baths
4,000
Sq Ft
$192/Sq Ft
Est. Value
About This Home
This home is located at 130 West St Unit Lot 0, Granby, MA 01033 and is currently estimated at $769,040, approximately $192 per square foot. 130 West St Unit Lot 0 is a home located in Hampshire County with nearby schools including East Meadow School, Granby Junior/Senior High School, and The MacDuffie School.
Ownership History
Date
Name
Owned For
Owner Type
Purchase Details
Closed on
Dec 16, 2020
Sold by
Instrum Khaled A and Zepke Jessica D
Bought by
Instrum Khaled A
Current Estimated Value
Home Financials for this Owner
Home Financials are based on the most recent Mortgage that was taken out on this home.
Original Mortgage
$383,600
Outstanding Balance
$341,518
Interest Rate
2.7%
Mortgage Type
New Conventional
Estimated Equity
$427,522
Purchase Details
Closed on
Aug 22, 2012
Sold by
Levi-Nielson Co Inc
Bought by
Instrum Khaled A and Zepke Jessica D
Home Financials for this Owner
Home Financials are based on the most recent Mortgage that was taken out on this home.
Original Mortgage
$417,000
Interest Rate
3.61%
Mortgage Type
Purchase Money Mortgage
Purchase Details
Closed on
Jun 8, 2007
Sold by
Mikolajcik Leo J Est
Bought by
Levi-Nielsen Co Inc
Create a Home Valuation Report for This Property
The Home Valuation Report is an in-depth analysis detailing your home's value as well as a comparison with similar homes in the area
Home Values in the Area
Average Home Value in this Area
Purchase History
| Date | Buyer | Sale Price | Title Company |
|---|---|---|---|
| Instrum Khaled A | -- | None Available | |
| Instrum Khaled A | -- | None Available | |
| Instrum Khaled A | $646,250 | -- | |
| Instrum Khaled A | $646,250 | -- | |
| Levi-Nielsen Co Inc | $250,000 | -- | |
| Levi & Nielsen Co Inc | $250,000 | -- |
Source: Public Records
Mortgage History
| Date | Status | Borrower | Loan Amount |
|---|---|---|---|
| Open | Instrum Khaled A | $383,600 | |
| Closed | Instrum Khaled A | $383,600 | |
| Previous Owner | Instrum Khaled A | $417,000 | |
| Previous Owner | Instrum Khaled A | $85,000 | |
| Previous Owner | Levi-Nielsen Co Inc | $630,000 | |
| Previous Owner | Levi-Nielsen Co Inc | $750,000 |
Source: Public Records
Tax History Compared to Growth
Tax History
| Year | Tax Paid | Tax Assessment Tax Assessment Total Assessment is a certain percentage of the fair market value that is determined by local assessors to be the total taxable value of land and additions on the property. | Land | Improvement |
|---|---|---|---|---|
| 2025 | $12,173 | $792,000 | $96,400 | $695,600 |
| 2024 | $12,037 | $785,200 | $91,400 | $693,800 |
| 2023 | $11,481 | $671,000 | $81,800 | $589,200 |
| 2022 | $10,721 | $562,500 | $81,800 | $480,700 |
| 2021 | $10,310 | $519,400 | $81,800 | $437,600 |
| 2020 | $10,203 | $516,100 | $79,400 | $436,700 |
| 2019 | $9,357 | $483,300 | $98,600 | $384,700 |
| 2018 | $8,911 | $447,100 | $98,600 | $348,500 |
| 2017 | $8,093 | $447,100 | $98,600 | $348,500 |
| 2016 | $7,825 | $414,700 | $91,400 | $323,300 |
| 2015 | $7,593 | $414,700 | $91,400 | $323,300 |
Source: Public Records
Map
Nearby Homes
- 73 Amherst St
- 18 Smith Ave
- 121 Cold Hill Rd
- Lot 6 Cold Hill
- 55 Pleasant St Unit 4
- 31 College View Heights
- 75 Silver St
- 4 Porter St
- 5 Country View Ln
- 67 Amherst Rd Unit 67
- 12-r Jackielyn Cir
- 200 East St
- 17 Woodbridge St
- 586 Granby Rd
- 2 Skinnerwoods Way Unit 2
- 115 Woodbridge St
- 540 Granby Rd Unit 72A
- 540 Granby Rd Unit 109
- 540 Granby Rd Unit 62
- 540 Granby Rd Unit 2