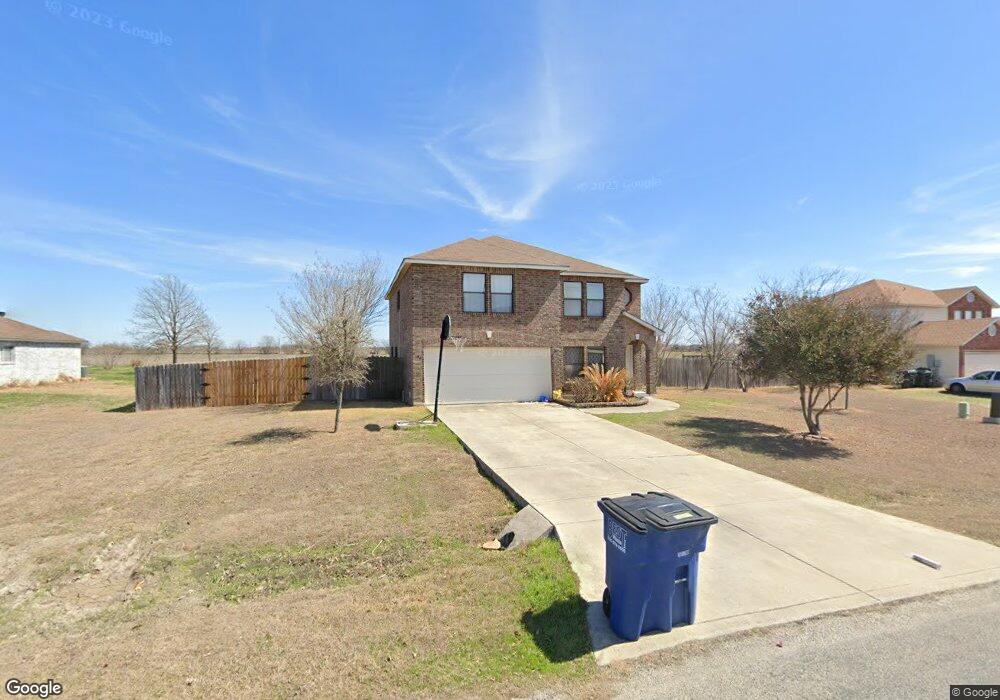
1300 Cordova Loop Unit 3 Seguin, TX 78155
Estimated Value: $338,000 - $485,000
4
Beds
3
Baths
2,602
Sq Ft
$149/Sq Ft
Est. Value
About This Home
This home is located at 1300 Cordova Loop Unit 3, Seguin, TX 78155 and is currently estimated at $388,282, approximately $149 per square foot. 1300 Cordova Loop Unit 3 is a home located in Guadalupe County with nearby schools including Navarro Elementary School, Navarro Intermediate School, and Navarro Junior High School.
Ownership History
Date
Name
Owned For
Owner Type
Purchase Details
Closed on
Sep 28, 2009
Sold by
Federal Home Loan Mortgage Corporation
Bought by
Moreno Luis J and Moreno Adriana C
Current Estimated Value
Home Financials for this Owner
Home Financials are based on the most recent Mortgage that was taken out on this home.
Original Mortgage
$144,337
Outstanding Balance
$94,009
Interest Rate
5.03%
Mortgage Type
FHA
Estimated Equity
$294,273
Purchase Details
Closed on
Feb 3, 2009
Sold by
Fritz Gregory Wayne
Bought by
Federal Home Loan Mortgage Corp
Purchase Details
Closed on
Jul 27, 2005
Sold by
Mueller Stuart A and Mueller Cynthia S
Bought by
Fritz Gregory Wayne
Home Financials for this Owner
Home Financials are based on the most recent Mortgage that was taken out on this home.
Original Mortgage
$122,400
Interest Rate
5.51%
Mortgage Type
New Conventional
Create a Home Valuation Report for This Property
The Home Valuation Report is an in-depth analysis detailing your home's value as well as a comparison with similar homes in the area
Home Values in the Area
Average Home Value in this Area
Purchase History
| Date | Buyer | Sale Price | Title Company |
|---|---|---|---|
| Moreno Luis J | -- | First American | |
| Federal Home Loan Mortgage Corp | $130,500 | None Available | |
| Fritz Gregory Wayne | -- | Atc New Braunfels |
Source: Public Records
Mortgage History
| Date | Status | Borrower | Loan Amount |
|---|---|---|---|
| Open | Moreno Luis J | $144,337 | |
| Previous Owner | Fritz Gregory Wayne | $122,400 |
Source: Public Records
Tax History
| Year | Tax Paid | Tax Assessment Tax Assessment Total Assessment is a certain percentage of the fair market value that is determined by local assessors to be the total taxable value of land and additions on the property. | Land | Improvement |
|---|---|---|---|---|
| 2025 | $3,797 | $349,987 | $46,651 | $303,336 |
| 2024 | $3,797 | $333,248 | $68,930 | $264,318 |
| 2023 | $4,990 | $341,045 | $53,409 | $354,000 |
| 2022 | $5,232 | $310,041 | $46,622 | $314,602 |
| 2021 | $4,644 | $281,855 | $34,460 | $250,645 |
| 2020 | $4,248 | $259,630 | $40,770 | $218,860 |
| 2019 | $4,034 | $244,388 | $22,950 | $221,438 |
| 2018 | $3,663 | $224,189 | $22,950 | $201,239 |
| 2017 | $2,678 | $219,870 | $22,950 | $196,920 |
| 2016 | $3,036 | $175,010 | $23,625 | $151,385 |
| 2015 | $2,678 | $187,987 | $14,850 | $173,137 |
| 2014 | $3,032 | $186,114 | $13,500 | $172,614 |
Source: Public Records
Map
Nearby Homes
- 1132 Cordova Loop
- 152 Cordova Crossing
- 165 Cordova Crossing
- 227 Cordova Crossing
- 337 Cordova Crossing
- 348 Cordova Terrace
- 2725 San Martin Ln
- TBD Huber Rd
- 2741 Nueva Cordova
- 4612 Prairie Summit
- 4121 Bermuda Ln
- 4125 Bermuda Ln
- 4129 Bermuda Ln
- 4133 Bermuda Ln
- 4057 Bermuda Ln
- 4141 Bermuda Ln
- 4145 Bermuda Ln
- 4153 Bermuda Ln
- 4037 Bermuda Ln
- 4061 Bermuda Ln
- 1300 Cordova Loop
- 1276 Cordova Loop
- 1324 Cordova Loop
- 1252 Cordova Loop
- 1348 Cordova Loop
- 1301 Cordova Loop
- 1277 Cordova Loop
- 1325 Cordova Loop
- 1228 Cordova Loop
- 1372 Cordova Loop
- 1349 Cordova Loop
- 1229 Cordova Loop
- 1204 Cordova Loop
- 1373 Cordova Loop
- 206 Double Creek Loop
- 214 Double Creek Loop
- 1396 Cordova Loop
- 234 Double Creek Loop
- 230 Double Creek Loop
- 1205 Cordova Loop
Your Personal Tour Guide
Ask me questions while you tour the home.