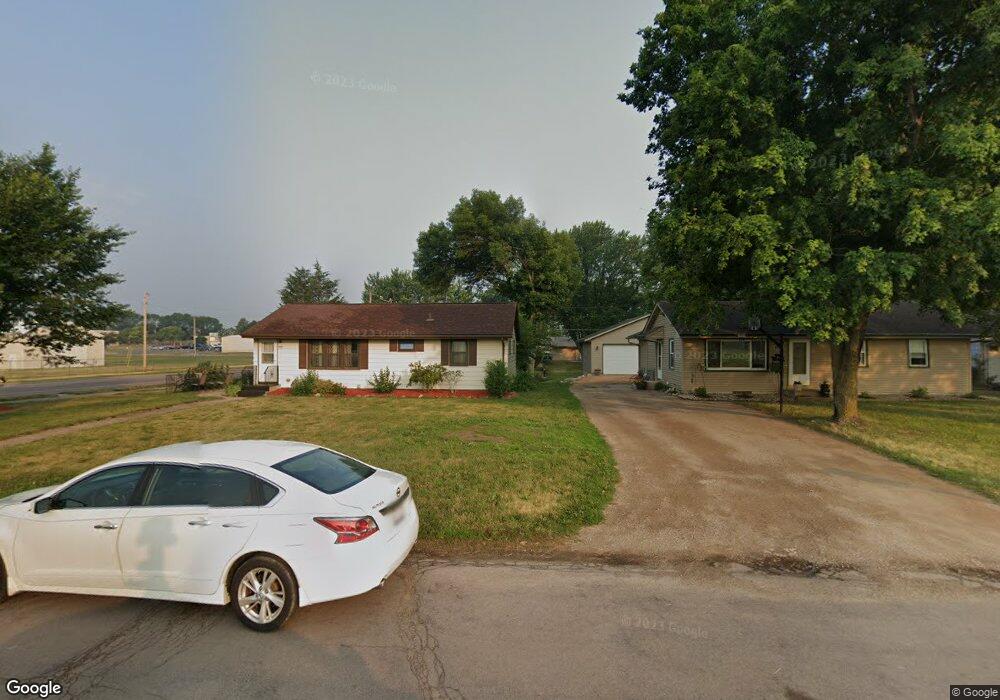
1300 Hazel St Le Sueur, MN 56058
Estimated Value: $184,000 - $235,000
3
Beds
2
Baths
960
Sq Ft
$227/Sq Ft
Est. Value
About This Home
This home is located at 1300 Hazel St, Le Sueur, MN 56058 and is currently estimated at $217,792, approximately $226 per square foot. 1300 Hazel St is a home located in Le Sueur County with nearby schools including Park Elementary School, Hilltop Elementary School, and Le Sueur-Henderson High School.
Ownership History
Date
Name
Owned For
Owner Type
Purchase Details
Closed on
Jun 25, 2024
Sold by
Elkhorn River Valley Properties Llc
Bought by
Voss Megan and Luskey Aaron
Current Estimated Value
Home Financials for this Owner
Home Financials are based on the most recent Mortgage that was taken out on this home.
Original Mortgage
$184,000
Outstanding Balance
$181,844
Interest Rate
7.09%
Mortgage Type
New Conventional
Estimated Equity
$35,948
Purchase Details
Closed on
Jul 2, 2018
Sold by
Rizor Barbara J
Bought by
Elkhorn River Valley Prop
Create a Home Valuation Report for This Property
The Home Valuation Report is an in-depth analysis detailing your home's value as well as a comparison with similar homes in the area
Home Values in the Area
Average Home Value in this Area
Purchase History
| Date | Buyer | Sale Price | Title Company |
|---|---|---|---|
| Voss Megan | $236,000 | -- | |
| Elkhorn River Valley Prop | $142,000 | -- |
Source: Public Records
Mortgage History
| Date | Status | Borrower | Loan Amount |
|---|---|---|---|
| Open | Voss Megan | $184,000 |
Source: Public Records
Tax History Compared to Growth
Tax History
| Year | Tax Paid | Tax Assessment Tax Assessment Total Assessment is a certain percentage of the fair market value that is determined by local assessors to be the total taxable value of land and additions on the property. | Land | Improvement |
|---|---|---|---|---|
| 2025 | $2,920 | $192,300 | $35,200 | $157,100 |
| 2024 | $3,228 | $192,300 | $35,200 | $157,100 |
| 2023 | $3,174 | $188,600 | $35,200 | $153,400 |
| 2022 | $5,310 | $178,900 | $35,200 | $143,700 |
| 2021 | $2,370 | $145,700 | $30,200 | $115,500 |
| 2020 | $2,414 | $140,700 | $30,200 | $110,500 |
| 2019 | $1,392 | $143,300 | $30,200 | $113,100 |
| 2018 | $1,377 | $76,000 | $18,433 | $57,567 |
| 2017 | $1,313 | $71,300 | $18,040 | $53,260 |
| 2016 | $810 | $68,500 | $17,796 | $50,704 |
| 2015 | $795 | $69,500 | $17,890 | $51,610 |
| 2014 | $715 | $66,600 | $17,611 | $48,989 |
| 2013 | $700 | $66,600 | $17,611 | $48,989 |
Source: Public Records
Map
Nearby Homes