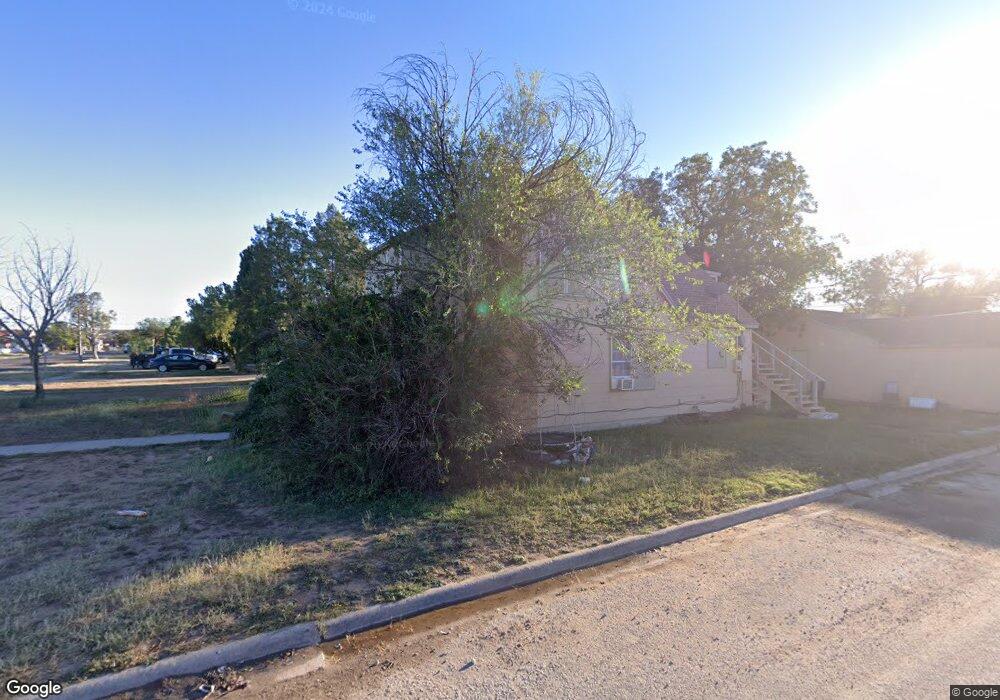
1300 Johnson St Big Spring, TX 79720
Estimated Value: $146,000 - $173,116
Studio
--
Bath
3,414
Sq Ft
$47/Sq Ft
Est. Value
About This Home
This home is located at 1300 Johnson St, Big Spring, TX 79720 and is currently estimated at $159,029, approximately $46 per square foot. 1300 Johnson St is a home located in Howard County with nearby schools including Big Spring High School, St. Mary's Episcopal School, and Nazarene Christian Academy Big Spring.
Ownership History
Date
Name
Owned For
Owner Type
Purchase Details
Closed on
May 18, 2011
Sold by
Fuqua Trenton Clay
Bought by
Campbell Gene and Campbell Mary Jane
Current Estimated Value
Purchase Details
Closed on
Aug 20, 2007
Sold by
Eason Thomas L
Bought by
Gillespie Amanda K
Purchase Details
Closed on
Apr 19, 2006
Sold by
Campbell Gene and Campbell Mary Jane
Bought by
Eason Thomas L and Gillespie Amanda K
Home Financials for this Owner
Home Financials are based on the most recent Mortgage that was taken out on this home.
Original Mortgage
$43,500
Interest Rate
6.32%
Mortgage Type
Purchase Money Mortgage
Purchase Details
Closed on
Dec 5, 2005
Sold by
Strickland Ernest M and Strickland Laura M
Bought by
Campbell Gene and Campbell Mary Jane
Create a Home Valuation Report for This Property
The Home Valuation Report is an in-depth analysis detailing your home's value as well as a comparison with similar homes in the area
Purchase History
| Date | Buyer | Sale Price | Title Company |
|---|---|---|---|
| Campbell Gene | $43,500 | None Available | |
| Gillespie Amanda K | -- | None Available | |
| Eason Thomas L | $43,500 | None Available | |
| Campbell Gene | $50,000 | None Available |
Source: Public Records
Mortgage History
| Date | Status | Borrower | Loan Amount |
|---|---|---|---|
| Previous Owner | Eason Thomas L | $43,500 |
Source: Public Records
Tax History
| Year | Tax Paid | Tax Assessment Tax Assessment Total Assessment is a certain percentage of the fair market value that is determined by local assessors to be the total taxable value of land and additions on the property. | Land | Improvement |
|---|---|---|---|---|
| 2025 | $2,575 | $132,080 | $10,520 | $121,560 |
| 2024 | $2,350 | $132,080 | $10,520 | $121,560 |
| 2023 | $2,182 | $123,799 | $7,000 | $116,799 |
| 2022 | $2,370 | $116,084 | $7,000 | $109,084 |
| 2021 | $2,979 | $126,765 | $7,000 | $119,765 |
| 2019 | $3,323 | $131,376 | $7,000 | $124,376 |
| 2018 | $3,996 | $133,357 | $7,000 | $126,357 |
| 2017 | $4,076 | $138,492 | $7,000 | $131,492 |
| 2016 | $4,112 | $139,720 | $7,000 | $132,720 |
| 2015 | -- | $140,949 | $7,000 | $133,949 |
| 2014 | -- | $47,652 | $1,500 | $46,152 |
Source: Public Records
Map
Nearby Homes
- 1202 Runnels St
- 1405 Nolan St
- 501 E 15th St
- 108 E 11th Place
- 502 E 12th St
- 605 E 12th St
- 607 E 15th St
- 1011 Scurry St
- 1513 Scurry St
- 1009 Scurry St
- 1700 S Main St
- 1407 Owens St
- 1808 Johnson St
- 809 E 15th St
- 811 E 16th St
- 1903 Runnels St
- 1904 Johnson St
- 1903 S Main St
- 1810 S Benton St
- 2006 Runnels St
- 1302 Johnson St
- 1304 Johnson St
- 1304 Johnson Ave
- 1210 Johnson St
- 1306 Johnson St
- 1301 Johnson St
- 1303 Johnson St
- 305 E 13th St
- 1206 Johnson St
- 1211 Johnson St
- 1308 Johnson St
- 1305 Johnson St
- 1303 Runnels St
- 1211 Runnels St
- 1305 Runnels St
- 1209 Johnson St
- 1209 Runnels St
- 1309 Johnson St
- 1307 Runnels St
- 1310 Johnson St
Your Personal Tour Guide
Ask me questions while you tour the home.