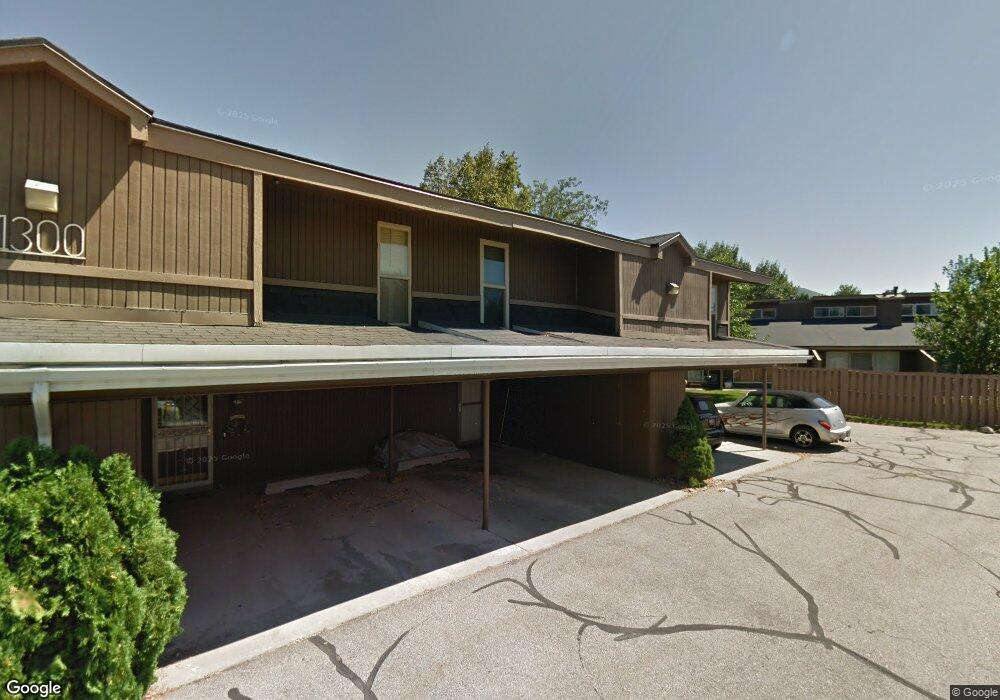
1300 Lorl Ln Unit P103 Ogden, UT 84404
Canyon Road NeighborhoodEstimated Value: $225,000 - $258,000
1
Bed
1
Bath
942
Sq Ft
$256/Sq Ft
Est. Value
About This Home
This home is located at 1300 Lorl Ln Unit P103, Ogden, UT 84404 and is currently estimated at $241,183, approximately $256 per square foot. 1300 Lorl Ln Unit P103 is a home located in Weber County with nearby schools including Mound Fort Junior High School and Ben Lomond High School.
Ownership History
Date
Name
Owned For
Owner Type
Purchase Details
Closed on
Oct 4, 2023
Sold by
Proudflt Robert L
Bought by
Saxton Kamdin
Current Estimated Value
Purchase Details
Closed on
Oct 8, 2004
Sold by
Hud
Bought by
Proudfit Robert L
Home Financials for this Owner
Home Financials are based on the most recent Mortgage that was taken out on this home.
Original Mortgage
$52,380
Interest Rate
5.77%
Mortgage Type
FHA
Purchase Details
Closed on
Jun 30, 2004
Sold by
Aurora Loan Services Inc
Bought by
Hud
Purchase Details
Closed on
May 25, 2004
Sold by
Jensen Jenny R
Bought by
Aurora Loan Services Inc
Purchase Details
Closed on
Sep 20, 2001
Sold by
Proudfit Robert L
Bought by
Jensen Jenny R
Purchase Details
Closed on
Apr 30, 1997
Sold by
Hyde Tonya L
Bought by
Proudfit Robert L
Create a Home Valuation Report for This Property
The Home Valuation Report is an in-depth analysis detailing your home's value as well as a comparison with similar homes in the area
Home Values in the Area
Average Home Value in this Area
Purchase History
| Date | Buyer | Sale Price | Title Company |
|---|---|---|---|
| Saxton Kamdin | -- | Us Title | |
| Proudfit Robert L | -- | Monument Title | |
| Hud | -- | First Southwestern Title Age | |
| Aurora Loan Services Inc | $78,358 | Inwest Title Ogden | |
| Jensen Jenny R | -- | Associated Title | |
| Proudfit Robert L | -- | Mountain View Title |
Source: Public Records
Mortgage History
| Date | Status | Borrower | Loan Amount |
|---|---|---|---|
| Previous Owner | Proudfit Robert L | $52,380 |
Source: Public Records
Tax History Compared to Growth
Tax History
| Year | Tax Paid | Tax Assessment Tax Assessment Total Assessment is a certain percentage of the fair market value that is determined by local assessors to be the total taxable value of land and additions on the property. | Land | Improvement |
|---|---|---|---|---|
| 2025 | $1,672 | $245,075 | $60,000 | $185,075 |
| 2024 | $1,598 | $126,500 | $33,000 | $93,500 |
| 2023 | $1,643 | $130,900 | $33,000 | $97,900 |
| 2022 | $1,583 | $126,500 | $33,000 | $93,500 |
| 2021 | $1,327 | $176,000 | $35,000 | $141,000 |
| 2020 | $1,192 | $146,000 | $22,000 | $124,000 |
| 2019 | $991 | $114,000 | $18,000 | $96,000 |
| 2018 | $866 | $99,000 | $18,000 | $81,000 |
| 2017 | $693 | $74,000 | $13,000 | $61,000 |
| 2016 | $620 | $35,750 | $7,150 | $28,600 |
| 2015 | $576 | $32,451 | $7,150 | $25,301 |
| 2014 | $577 | $31,900 | $7,150 | $24,750 |
Source: Public Records
Map
Nearby Homes
- 1300 Lorl Ln Unit 2
- 1333 Lorl Ln Unit 6
- 2130 S Harrison Blvd
- 1281 16th St
- 1286 1640 S
- 1175 Canyon Rd Unit 77
- 1175 Canyon Rd Unit A13
- 1175 Canyon Rd Unit A21
- 1175 Canyon Rd Unit 81
- 1435 S 1195 E Unit 19
- 1184 16th St Unit B
- 1522 Robins Cir
- 1158 16th St
- 1439 E 1250 S
- 1120 Canyon Rd Unit 38
- 1120 Canyon Rd Unit 19
- 1120 Canyon Rd Unit 44
- 1427 Blossom Ln
- 1076 Creekside Dr
- 1160 12th St
- 1300 Lorl Ln
- 1300 Lorl Ln Unit 3
- 1300 Lorl Ln Unit 4
- 1300 Lorl Ln Unit 1
- 1300 Lorl Ln Unit 6
- 1300 Lorl Ln Unit 108
- 1298 Lorl Ln
- 1298 Lorl Ln Unit 5
- 1298 Lorl Ln Unit 4
- 1298 Lorl Ln Unit 3
- 1298 Lorl Ln Unit 1
- 1298 Lorl Ln Unit 101
- 1316 Lorl Ln Unit 4
- 1316 Lorl Ln Unit 3
- 1316 Lorl Ln Unit 2
- 1316 Lorl Ln Unit 1
- 1316 Lorl Ln
- 1316 Lorl Ln Unit 109
- 1320 Lorl Ln Unit 4
- 1320 Lorl Ln Unit 3