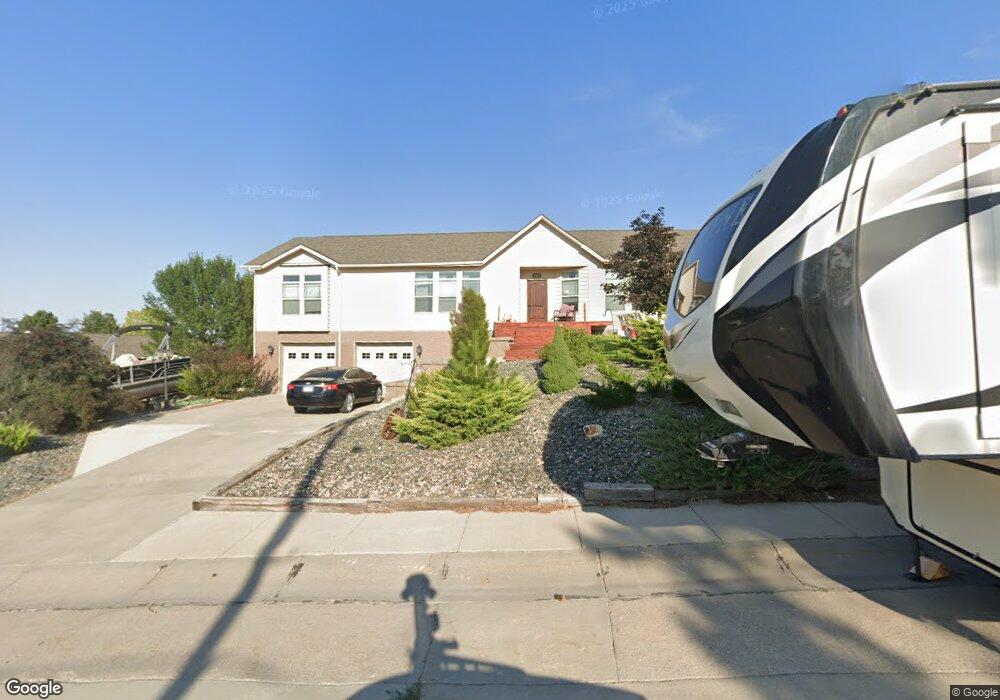
1300 Maple St Chadron, NE 69337
Estimated Value: $211,000 - $366,000
3
Beds
2
Baths
1,936
Sq Ft
$158/Sq Ft
Est. Value
About This Home
This home is located at 1300 Maple St, Chadron, NE 69337 and is currently estimated at $306,667, approximately $158 per square foot. 1300 Maple St is a home located in Dawes County with nearby schools including Chadron Primary School, Chadron Intermediate School, and Chadron Middle School.
Ownership History
Date
Name
Owned For
Owner Type
Purchase Details
Closed on
Jan 30, 2015
Sold by
Federal Home Loan Mortgage Corporation
Bought by
Briscoe Chance
Current Estimated Value
Purchase Details
Closed on
May 16, 2014
Sold by
Jpmorgan Chase Bank Na
Bought by
Federal Home Loan Mortgage Corporation
Purchase Details
Closed on
May 12, 2014
Sold by
Hays Marilyn and Hays Shane C
Bought by
Jpmorgam Chase Bank Na
Purchase Details
Closed on
Dec 7, 2009
Sold by
Hays Shane
Bought by
Hinn Marilyn
Create a Home Valuation Report for This Property
The Home Valuation Report is an in-depth analysis detailing your home's value as well as a comparison with similar homes in the area
Home Values in the Area
Average Home Value in this Area
Purchase History
| Date | Buyer | Sale Price | Title Company |
|---|---|---|---|
| Briscoe Chance | -- | None Available | |
| Federal Home Loan Mortgage Corporation | -- | Continental Title Co | |
| Jpmorgam Chase Bank Na | -- | Continental Title | |
| Hinn Marilyn | -- | None Available |
Source: Public Records
Tax History
| Year | Tax Paid | Tax Assessment Tax Assessment Total Assessment is a certain percentage of the fair market value that is determined by local assessors to be the total taxable value of land and additions on the property. | Land | Improvement |
|---|---|---|---|---|
| 2025 | $4,070 | $293,825 | $55,035 | $238,790 |
| 2024 | $5,067 | $279,835 | $52,415 | $227,420 |
| 2023 | $5,067 | $279,835 | $52,415 | $227,420 |
| 2022 | $4,174 | $221,535 | $2,545 | $218,990 |
| 2021 | $4,011 | $207,970 | $2,670 | $205,300 |
| 2020 | $3,839 | $198,070 | $2,545 | $195,525 |
| 2019 | $3,793 | $198,070 | $2,545 | $195,525 |
| 2018 | $4,020 | $211,460 | $15,935 | $195,525 |
| 2017 | $3,969 | $211,460 | $15,935 | $195,525 |
| 2016 | $1,868 | $99,305 | $15,935 | $83,370 |
| 2015 | $1,848 | $99,305 | $15,935 | $83,370 |
| 2012 | -- | $181,930 | $15,935 | $165,995 |
Source: Public Records
Map
Nearby Homes
- 1325 Maple St
- 932 Chadron Ave
- 828 Chadron Ave
- 926 Bordeaux St
- 527 Shelton St
- 528 Shelton St
- 334 Morehead St
- 800 E 10th St
- 187 Milo Rd
- 820 W 3rd St
- 830 E 9th St
- 809 E 5th St
- 545 Beech St
- 230 Shelton St
- 116 Pine St
- 370 Country Club Rd
- 418 W Niobrara Ave
- 31 Stockade Rd Unit 2
- 0 Tbd West Hills Rd
- 362-364 Beaver Valley Rd
Your Personal Tour Guide
Ask me questions while you tour the home.