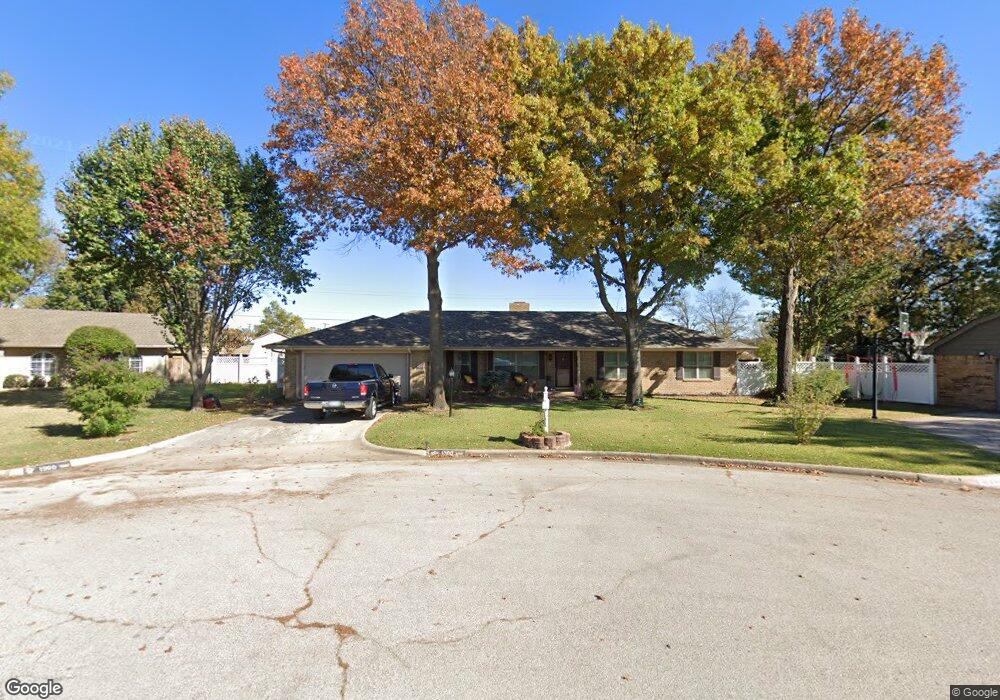
1300 Sunny Ln Ardmore, OK 73401
Estimated Value: $247,009 - $282,000
3
Beds
2
Baths
1,801
Sq Ft
$150/Sq Ft
Est. Value
About This Home
This home is located at 1300 Sunny Ln, Ardmore, OK 73401 and is currently estimated at $269,502, approximately $149 per square foot. 1300 Sunny Ln is a home located in Carter County with nearby schools including Plainview Primary School, Plainview Intermediate School, and Plainview Middle School.
Ownership History
Date
Name
Owned For
Owner Type
Purchase Details
Closed on
Nov 7, 2022
Sold by
Ray Mary L
Bought by
Pate Alan
Current Estimated Value
Home Financials for this Owner
Home Financials are based on the most recent Mortgage that was taken out on this home.
Original Mortgage
$210,614
Outstanding Balance
$203,779
Interest Rate
6.7%
Mortgage Type
FHA
Estimated Equity
$65,723
Purchase Details
Closed on
Aug 31, 2001
Sold by
Richardson Richardson A and Richardson Barbar
Bought by
Ray Rick A and Ray Mary L
Purchase Details
Closed on
Mar 4, 1998
Sold by
Shrader Claudia
Bought by
Richardson Richardson A and Richardson Barb
Create a Home Valuation Report for This Property
The Home Valuation Report is an in-depth analysis detailing your home's value as well as a comparison with similar homes in the area
Home Values in the Area
Average Home Value in this Area
Purchase History
| Date | Buyer | Sale Price | Title Company |
|---|---|---|---|
| Pate Alan | $214,500 | Stewart Title Guaranty Company | |
| Ray Rick A | $122,000 | -- | |
| Richardson Richardson A | $88,000 | -- |
Source: Public Records
Mortgage History
| Date | Status | Borrower | Loan Amount |
|---|---|---|---|
| Open | Pate Alan | $210,614 |
Source: Public Records
Tax History Compared to Growth
Tax History
| Year | Tax Paid | Tax Assessment Tax Assessment Total Assessment is a certain percentage of the fair market value that is determined by local assessors to be the total taxable value of land and additions on the property. | Land | Improvement |
|---|---|---|---|---|
| 2024 | $2,604 | $27,027 | $3,600 | $23,427 |
| 2023 | $2,479 | $25,740 | $3,600 | $22,140 |
| 2022 | $1,562 | $18,243 | $2,848 | $15,395 |
| 2021 | $1,557 | $17,711 | $2,786 | $14,925 |
| 2020 | $1,525 | $17,196 | $2,679 | $14,517 |
| 2019 | $1,440 | $16,695 | $3,049 | $13,646 |
| 2018 | $1,381 | $16,209 | $2,242 | $13,967 |
| 2017 | $1,345 | $15,737 | $2,139 | $13,598 |
| 2016 | $1,310 | $15,279 | $2,508 | $12,771 |
| 2015 | $1,306 | $14,833 | $2,265 | $12,568 |
| 2014 | $1,268 | $14,401 | $1,556 | $12,845 |
Source: Public Records
Map
Nearby Homes
- 1413 Sunny Ln
- 1501 Rosedale St
- 1500 Rosedale St
- 1507 Sunny Ln
- 1508 Sunny Ln
- 1602 Rosedale St
- 1319 Brookhaven St
- 1014 S Commerce St
- 1223 Buckingham
- 1702 Olive St
- 1831 Sunset Park Terrace
- 1834 Sunset Park Terrace
- 835 Sunset Ct
- 914 Hailey St SW
- 915 G St SW
- 924 Manor Mall
- 930 P St SW Unit 3
- 1121 Surrey Dr
- 1024 C St SW
- 917 Q St SW
- 1401 Sunny Ln
- 1302 Sunny Ln
- 1405 Sunny Ln
- 1400 Sunny Ln
- 1306 Sunny Ln
- 1417 Windsor Dr
- 1419 Windsor Dr
- 1415 Windsor Dr
- 1409 Sunny Ln
- 1421 Windsor Dr
- 1305 Sunny Ln
- 1404 Sunny Ln
- 1310 Sunny Ln
- 1423 Windsor Dr
- 1413 Windsor Dr
- 1425 Windsor Dr
- 1427 Windsor Dr
- 1407 Rosedale St
- 1411 Windsor Dr
- 1429 Windsor Dr