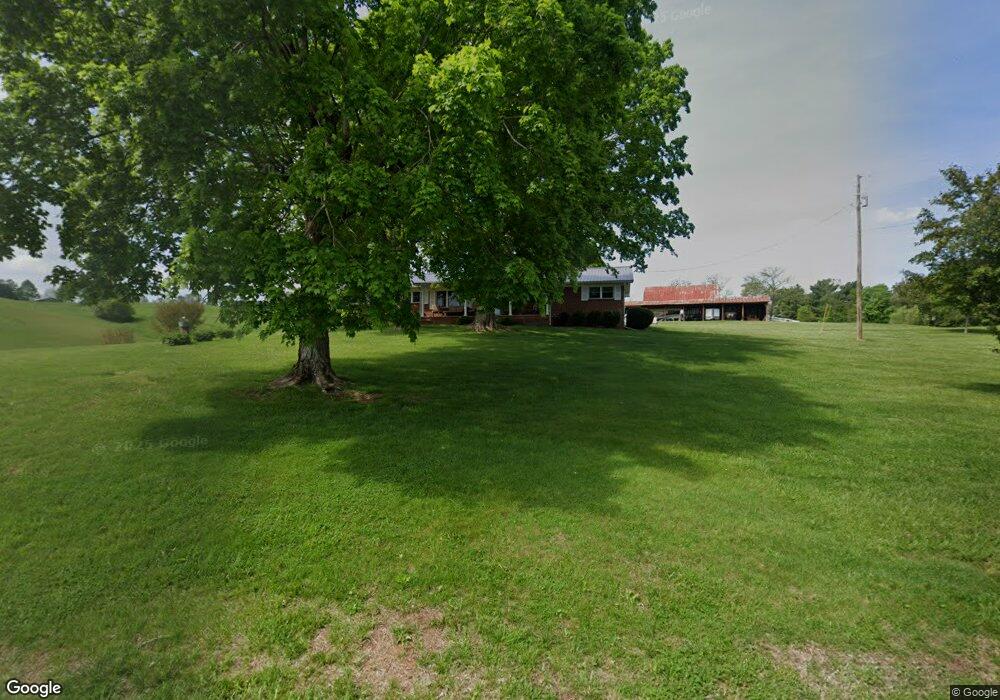
1300 Tarr Rd Talbott, TN 37877
Estimated Value: $273,000 - $371,000
3
Beds
1
Bath
1,653
Sq Ft
$194/Sq Ft
Est. Value
About This Home
This home is located at 1300 Tarr Rd, Talbott, TN 37877 and is currently estimated at $320,942, approximately $194 per square foot. 1300 Tarr Rd is a home located in Hamblen County with nearby schools including Alpha Elementary School, West View Middle School, and Morristown West High School.
Ownership History
Date
Name
Owned For
Owner Type
Purchase Details
Closed on
Aug 26, 2016
Sold by
Seahorn Victoria J
Bought by
Roethel Edward J and Roethel Kelly D
Current Estimated Value
Purchase Details
Closed on
Jul 17, 2016
Sold by
Seahorn Victoria J
Bought by
Seahorn Victoria J and Jones Billie Sue
Purchase Details
Closed on
Jan 20, 2012
Sold by
Seahorn Imogene
Bought by
Robbins Ronnie Dan and Robbins Nannie R
Purchase Details
Closed on
Jul 14, 2003
Sold by
Mcmurray Martha
Bought by
Seahorn Imogene
Purchase Details
Closed on
Nov 27, 1998
Bought by
Seahorn Imogene
Purchase Details
Closed on
Aug 25, 1998
Bought by
Mcmurray Martha H
Purchase Details
Closed on
Mar 15, 1997
Sold by
Charles Wilson
Bought by
Rogers U M
Purchase Details
Closed on
Feb 14, 1997
Sold by
Charles Wilson
Bought by
Charles Wilson
Purchase Details
Closed on
Dec 5, 1996
Sold by
Mcmurray James G
Bought by
Greene S W
Purchase Details
Closed on
Oct 14, 1949
Bought by
Mcmurray James G and Mcmurray Martha H
Create a Home Valuation Report for This Property
The Home Valuation Report is an in-depth analysis detailing your home's value as well as a comparison with similar homes in the area
Purchase History
| Date | Buyer | Sale Price | Title Company |
|---|---|---|---|
| Roethel Edward J | $142,000 | -- | |
| Seahorn Victoria J | -- | -- | |
| Robbins Ronnie Dan | $45,000 | -- | |
| Seahorn Imogene | $60,000 | -- | |
| Seahorn Imogene | $60,000 | -- | |
| Mcmurray Martha H | $100 | -- | |
| Rogers U M | $225,500 | -- | |
| Charles Wilson | $69,342 | -- | |
| Greene S W | $450,000 | -- | |
| Mcmurray James G | -- | -- |
Source: Public Records
Tax History
| Year | Tax Paid | Tax Assessment Tax Assessment Total Assessment is a certain percentage of the fair market value that is determined by local assessors to be the total taxable value of land and additions on the property. | Land | Improvement |
|---|---|---|---|---|
| 2025 | $1,083 | $73,675 | $10,825 | $62,850 |
| 2024 | $911 | $46,225 | $13,525 | $32,700 |
| 2023 | $911 | $46,225 | $0 | $0 |
| 2022 | $911 | $46,225 | $13,525 | $32,700 |
| 2021 | $911 | $46,225 | $13,525 | $32,700 |
| 2020 | $911 | $46,225 | $13,525 | $32,700 |
| 2019 | $777 | $36,500 | $7,400 | $29,100 |
| 2018 | $777 | $36,500 | $7,400 | $29,100 |
| 2017 | $777 | $36,500 | $7,400 | $29,100 |
| 2016 | $726 | $36,500 | $7,400 | $29,100 |
| 2015 | $675 | $36,500 | $7,400 | $29,100 |
| 2014 | -- | $36,500 | $7,400 | $29,100 |
| 2013 | -- | $38,475 | $0 | $0 |
Source: Public Records
Map
Nearby Homes
- 8070 W Pointe Dr
- 634 Heather Brook Cir
- 1437 Beacon Rd
- tbd Lebanon Church Rd
- 463 Heather Brook Dr
- 7713 Melanie Cir
- 120 Waverly Path
- 2320 Beacon Rd
- 248 Belle Ct
- 2559 Dogwood Ln
- 510 E Old Andrew Johnson Hwy
- 1171 W E Hwy 11e E
- 2232 Center Cir
- 595 Ricky Dr
- 0 Boxwood Ln
- 413 English Dr
- 104 Claire Place
- 158 Claire Place
- 2451 Black Oak Rd
- 1205 Cole
- 0 Hulls Mill Rd
- 8196 Hulls Mill Rd
- 8198 W Pointe Dr
- 2586 Liberty Rd
- 8200 Hulls Mill Rd
- 8164 Hulls Mill Rd
- 8184 W Pointe Dr
- 8090 Hulls Mill Rd
- 1250 Tarr Rd
- 8097 Hulls Mill Rd
- 8189 W Pointe Dr
- 8176 W Pointe Dr
- 1181 Tarr Rd
- 8177 W Pointe Dr
- 1200 Tarr Rd
- 2503 Loggan Dr
- 8170 W Pointe Dr
- 8080 S Pointe Dr
- 8169 W Pointe Dr
- 8115 Greenbriar Rd
Your Personal Tour Guide
Ask me questions while you tour the home.