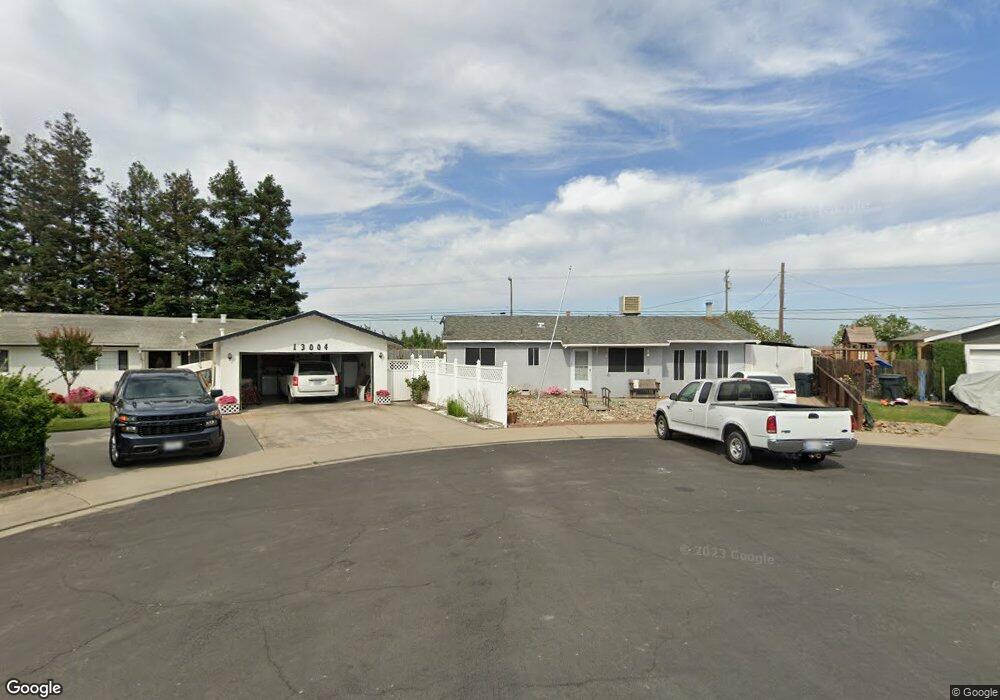
13000 Lorenzo Ct Hickman, CA 95323
Estimated Value: $273,000 - $429,000
3
Beds
2
Baths
1,444
Sq Ft
$236/Sq Ft
Est. Value
About This Home
This home is located at 13000 Lorenzo Ct, Hickman, CA 95323 and is currently estimated at $341,340, approximately $236 per square foot. 13000 Lorenzo Ct is a home located in Stanislaus County with nearby schools including Hickman Elementary School, Connecting Waters Charter School, and Hickman Middle School.
Ownership History
Date
Name
Owned For
Owner Type
Purchase Details
Closed on
Sep 28, 2025
Sold by
Strange Family Living Trust and Scroggs Julie Anna
Bought by
Belmonte Investments Llc
Current Estimated Value
Home Financials for this Owner
Home Financials are based on the most recent Mortgage that was taken out on this home.
Original Mortgage
$256,500
Interest Rate
6.58%
Mortgage Type
Construction
Purchase Details
Closed on
Oct 13, 2023
Sold by
Strange Steven A
Bought by
Stange Family Living Trust and Strange
Purchase Details
Closed on
Apr 6, 2011
Sold by
Strange Steven A
Bought by
Strange Steven A and Strange Antoinette G
Home Financials for this Owner
Home Financials are based on the most recent Mortgage that was taken out on this home.
Original Mortgage
$44,800
Interest Rate
4.9%
Mortgage Type
New Conventional
Create a Home Valuation Report for This Property
The Home Valuation Report is an in-depth analysis detailing your home's value as well as a comparison with similar homes in the area
Purchase History
| Date | Buyer | Sale Price | Title Company |
|---|---|---|---|
| Belmonte Investments Llc | -- | Placer Title | |
| Stange Family Living Trust | -- | None Listed On Document | |
| Strange Steven A | -- | Chicago Title Servicelink Di |
Source: Public Records
Mortgage History
| Date | Status | Borrower | Loan Amount |
|---|---|---|---|
| Previous Owner | Belmonte Investments Llc | $256,500 | |
| Previous Owner | Strange Steven A | $44,800 |
Source: Public Records
Tax History
| Year | Tax Paid | Tax Assessment Tax Assessment Total Assessment is a certain percentage of the fair market value that is determined by local assessors to be the total taxable value of land and additions on the property. | Land | Improvement |
|---|---|---|---|---|
| 2025 | $1,650 | $132,603 | $31,222 | $101,381 |
| 2024 | $1,656 | $130,004 | $30,610 | $99,394 |
| 2023 | $1,614 | $127,456 | $30,010 | $97,446 |
| 2022 | $1,583 | $124,958 | $29,422 | $95,536 |
| 2021 | $1,548 | $122,509 | $28,846 | $93,663 |
| 2020 | $1,521 | $121,254 | $28,551 | $92,703 |
| 2019 | $1,496 | $118,878 | $27,992 | $90,886 |
| 2018 | $1,458 | $116,548 | $27,444 | $89,104 |
| 2017 | $1,497 | $114,263 | $26,906 | $87,357 |
| 2016 | $1,438 | $112,024 | $26,379 | $85,645 |
| 2015 | $1,417 | $110,342 | $25,983 | $84,359 |
| 2014 | $1,405 | $108,182 | $25,475 | $82,707 |
Source: Public Records
Map
Nearby Homes
- 876 Lorenzo St
- 955 Elma St
- 966 Elma St
- 13249 Lake Rd
- 770 Merriam Rd
- 13807 Dallas Rd
- 328 Burns Creek Ct
- 13403 Rivercrest Dr
- 13702 Channel Ln
- 579 F St
- 13703 Coastal Ct
- 289 Dayflower Ct
- 292 Dayflower Ct
- 13319 Welch St
- 12024 Acosta Ct
- 571 F St
- 12073 Yosemite Blvd
- 13301 Bentley St
- 417 A St
- 12356 Rose Way
Your Personal Tour Guide
Ask me questions while you tour the home.