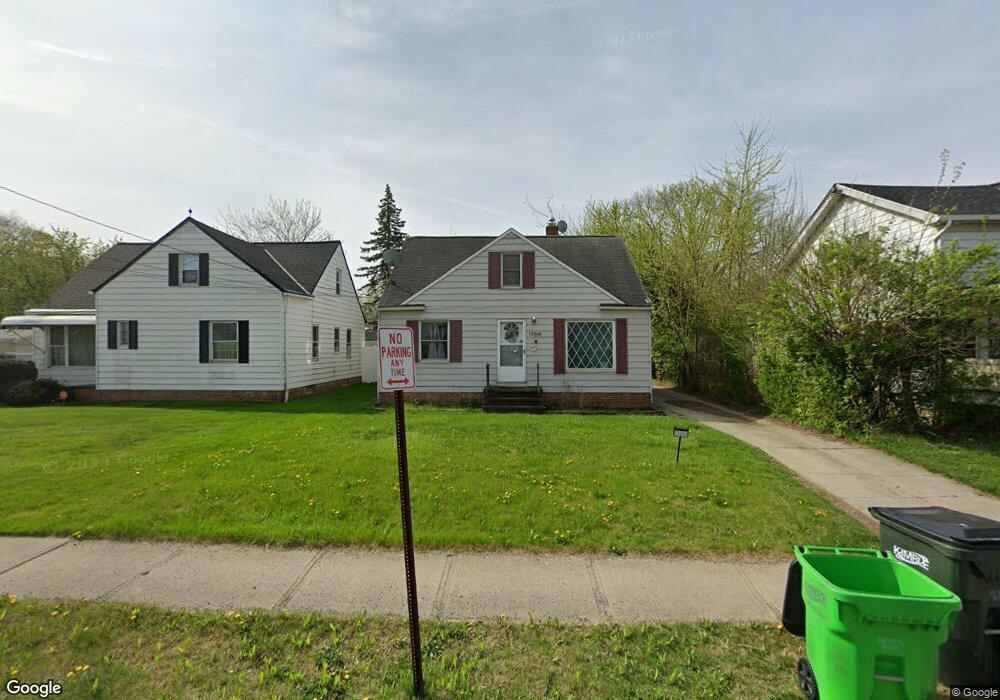
13000 Mccracken Rd Cleveland, OH 44125
Estimated Value: $132,375 - $218,000
3
Beds
2
Baths
1,218
Sq Ft
$129/Sq Ft
Est. Value
About This Home
This home is located at 13000 Mccracken Rd, Cleveland, OH 44125 and is currently estimated at $157,344, approximately $129 per square foot. 13000 Mccracken Rd is a home located in Cuyahoga County with nearby schools including Garfield Heights High School, SMART Academy, and North Shore High School.
Ownership History
Date
Name
Owned For
Owner Type
Purchase Details
Closed on
Nov 10, 2014
Sold by
Kerswell Graham H
Bought by
Pnc Bank National Association
Current Estimated Value
Purchase Details
Closed on
Jul 8, 2003
Sold by
Kelley Brian E
Bought by
Kerswell Graham H
Home Financials for this Owner
Home Financials are based on the most recent Mortgage that was taken out on this home.
Original Mortgage
$99,100
Interest Rate
5.36%
Mortgage Type
Purchase Money Mortgage
Purchase Details
Closed on
Aug 14, 1995
Sold by
Wilks Arthur
Bought by
Kelley Brian E
Home Financials for this Owner
Home Financials are based on the most recent Mortgage that was taken out on this home.
Original Mortgage
$61,027
Interest Rate
7.51%
Mortgage Type
New Conventional
Purchase Details
Closed on
Mar 15, 1985
Sold by
Wilks Arthur and Wilks Dorothy E
Bought by
Wlks Arthur and Wlks Dorothy E
Purchase Details
Closed on
Jan 1, 1975
Bought by
Wilks Arthur and Wilks Dorothy E
Create a Home Valuation Report for This Property
The Home Valuation Report is an in-depth analysis detailing your home's value as well as a comparison with similar homes in the area
Home Values in the Area
Average Home Value in this Area
Purchase History
| Date | Buyer | Sale Price | Title Company |
|---|---|---|---|
| Pnc Bank National Association | $20,000 | None Available | |
| Kerswell Graham H | $123,900 | Multiple | |
| Kelley Brian E | $65,000 | -- | |
| Wlks Arthur | -- | -- | |
| Wilks Arthur | -- | -- |
Source: Public Records
Mortgage History
| Date | Status | Borrower | Loan Amount |
|---|---|---|---|
| Previous Owner | Kerswell Graham H | $99,100 | |
| Previous Owner | Kelley Brian E | $61,027 | |
| Closed | Kerswell Graham H | $18,500 |
Source: Public Records
Tax History Compared to Growth
Tax History
| Year | Tax Paid | Tax Assessment Tax Assessment Total Assessment is a certain percentage of the fair market value that is determined by local assessors to be the total taxable value of land and additions on the property. | Land | Improvement |
|---|---|---|---|---|
| 2024 | $4,231 | $40,390 | $7,630 | $32,760 |
| 2023 | $2,806 | $24,260 | $5,810 | $18,450 |
| 2022 | $2,764 | $24,260 | $5,810 | $18,450 |
| 2021 | $2,919 | $24,260 | $5,810 | $18,450 |
| 2020 | $2,569 | $19,880 | $4,760 | $15,120 |
| 2019 | $2,951 | $56,800 | $13,600 | $43,200 |
| 2018 | $2,711 | $19,880 | $4,760 | $15,120 |
| 2017 | $2,701 | $19,890 | $4,380 | $15,510 |
| 2016 | $2,739 | $19,890 | $4,380 | $15,510 |
| 2015 | $3,872 | $19,890 | $4,380 | $15,510 |
| 2014 | $3,872 | $27,170 | $5,360 | $21,810 |
Source: Public Records
Map
Nearby Homes
- 12816 Mccracken Rd
- 5107 E 131st St
- 13005 Oak St
- 13319 Mccracken Rd
- 12908 Oak St
- 12830 Park Knoll Dr
- 12516 Park Knoll Dr
- 12514 Park Knoll Dr
- 12322 Garland Ave
- 5069 Henry St
- 13417 Granger Rd
- 13601 Granger Rd
- 5351 E 124th St
- 5368 E 129th St
- 5372 E 131st St
- 5384 E 132nd St
- 5392 E 131st St
- 12911 Bangor Ave
- 13216 Forestdale Dr
- 11703 Granger Rd
- 12914 Mccracken Rd
- 13004 Mccracken Rd
- 12904 Mccracken Rd
- 5106 E 131st St
- 12900 Mccracken Rd
- 12900 Mccracken Rd Unit 1/DN
- 12900 Mccracken Rd Unit 2/UP
- 12900 Mccracken Rd Unit 1/Down
- 5110 E 131st St
- 13104 Mccracken Rd
- 13015 Mccracken Rd
- 13017 Mccracken Rd
- 5114 E 131st St
- 13108 Mccracken Rd
- 13007 Mccracken Rd
- 13019 Mccracken Rd
- 12828 Mccracken Rd
- 13003 Mccracken Rd
- 5118 E 131st St
- 13013 Mccracken Rd