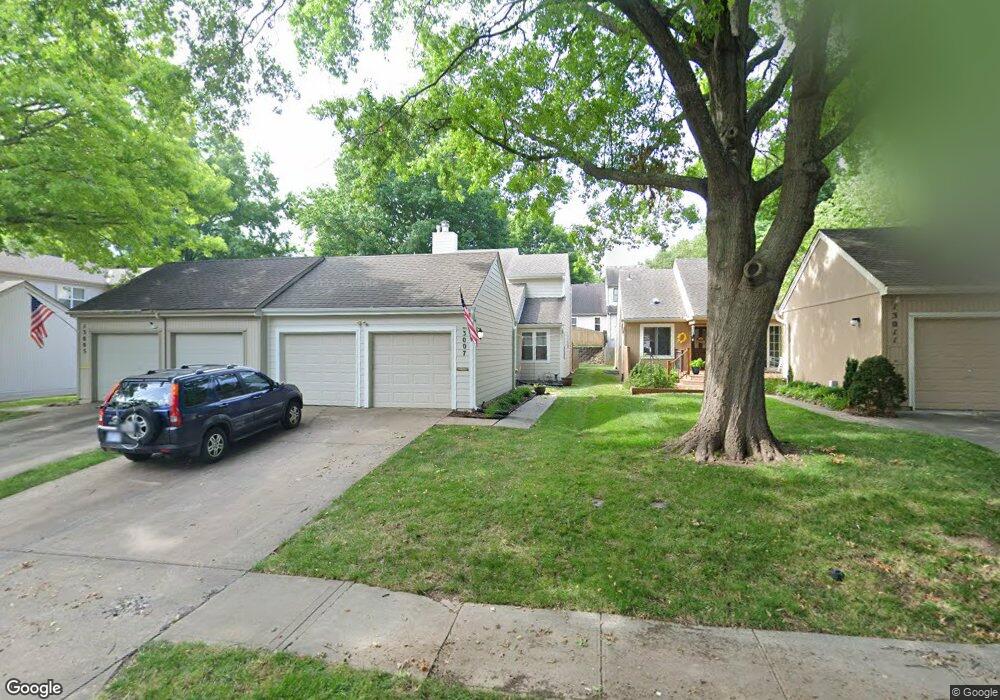
13007 W 66th St Shawnee, KS 66216
Estimated Value: $272,000 - $325,413
3
Beds
2
Baths
1,566
Sq Ft
$186/Sq Ft
Est. Value
About This Home
This home is located at 13007 W 66th St, Shawnee, KS 66216 and is currently estimated at $291,353, approximately $186 per square foot. 13007 W 66th St is a home located in Johnson County with nearby schools including Rhein Benninghoven Elementary School, Trailridge Middle School, and Shawnee Mission Northwest High School.
Ownership History
Date
Name
Owned For
Owner Type
Purchase Details
Closed on
Apr 12, 2021
Sold by
Losh Jason Thomas and Losh Stephanie Celeste
Bought by
Losh Family Living Trust and Losh Stephanie Celeste
Current Estimated Value
Home Financials for this Owner
Home Financials are based on the most recent Mortgage that was taken out on this home.
Original Mortgage
$140,000
Outstanding Balance
$126,129
Interest Rate
3%
Mortgage Type
New Conventional
Estimated Equity
$165,224
Purchase Details
Closed on
Jul 29, 2020
Sold by
Losh Jason and Losh Stephanie
Bought by
Losh Jason Thomas and Losh Stephanie Celeste
Purchase Details
Closed on
Jan 9, 2014
Sold by
Cameron Megan Rene
Bought by
Losh Jason and Losh Stephanie
Home Financials for this Owner
Home Financials are based on the most recent Mortgage that was taken out on this home.
Original Mortgage
$126,205
Interest Rate
4.62%
Mortgage Type
FHA
Create a Home Valuation Report for This Property
The Home Valuation Report is an in-depth analysis detailing your home's value as well as a comparison with similar homes in the area
Home Values in the Area
Average Home Value in this Area
Purchase History
| Date | Buyer | Sale Price | Title Company |
|---|---|---|---|
| Losh Family Living Trust | -- | All American | |
| Losh Jason Thomas | -- | New Title Company Name | |
| Losh Jason Thomas | -- | New Title Company Name | |
| Losh Jason Thomas | -- | None Available | |
| Losh Jason | -- | Platinum Title Llc |
Source: Public Records
Mortgage History
| Date | Status | Borrower | Loan Amount |
|---|---|---|---|
| Open | Losh Jason Thomas | $140,000 | |
| Closed | Losh Jason Thomas | $140,000 | |
| Previous Owner | Losh Jason | $126,205 |
Source: Public Records
Tax History Compared to Growth
Tax History
| Year | Tax Paid | Tax Assessment Tax Assessment Total Assessment is a certain percentage of the fair market value that is determined by local assessors to be the total taxable value of land and additions on the property. | Land | Improvement |
|---|---|---|---|---|
| 2024 | $2,806 | $26,830 | $4,646 | $22,184 |
| 2023 | $2,776 | $25,968 | $3,876 | $22,092 |
| 2022 | $2,368 | $22,081 | $3,370 | $18,711 |
| 2021 | $2,243 | $19,470 | $3,059 | $16,411 |
| 2020 | $2,045 | $17,503 | $2,777 | $14,726 |
| 2019 | $2,188 | $18,733 | $2,777 | $15,956 |
| 2018 | $2,168 | $18,492 | $2,777 | $15,715 |
| 2017 | $1,576 | $13,179 | $2,415 | $10,764 |
| 2016 | $1,695 | $14,007 | $2,415 | $11,592 |
| 2015 | $1,605 | $13,904 | $2,415 | $11,489 |
| 2013 | -- | $14,306 | $2,415 | $11,891 |
Source: Public Records
Map
Nearby Homes
- 12914 W 67th St
- 13415 W 66th Terrace
- 6640 Pflumm Rd
- 6564 Charles St
- 6556 Charles St
- 12225 W 64th Terrace
- 12300 W 67th Terrace
- 6610 Halsey St
- 12116 W 63rd Terrace
- 7105 Richards Dr
- 4908 Noland Rd
- Augusta Plan at Kenneth Estates
- Newport Plan at Kenneth Estates
- Rosemount II Plan at Kenneth Estates
- The Avala Villa Plan at Kenneth Estates
- The Rosemount Villa Plan at Kenneth Estates
- Catalina II Plan at Kenneth Estates
- The Avala Plan at Kenneth Estates
- 12811 W 71st St
- 11928 W 66th St
- 13005 W 66th St
- 13011 W 66th St
- 12917 W 66th St
- 13013 W 66th St
- 12915 W 66th St
- 13105 W 66th St
- 13002 W 66th Terrace
- 13004 W 66th Terrace
- 12911 W 66th St
- 13006 W 66th Terrace
- 13107 W 66th St
- 12916 W 66th Terrace
- 12909 W 66th St
- 12914 W 66th Terrace
- 13014 W 66th St
- 13010 W 66th St
- 6613 Noland Rd
- 12907 W 66th St
- 13006 W 66th St
- 13100 W 66th St