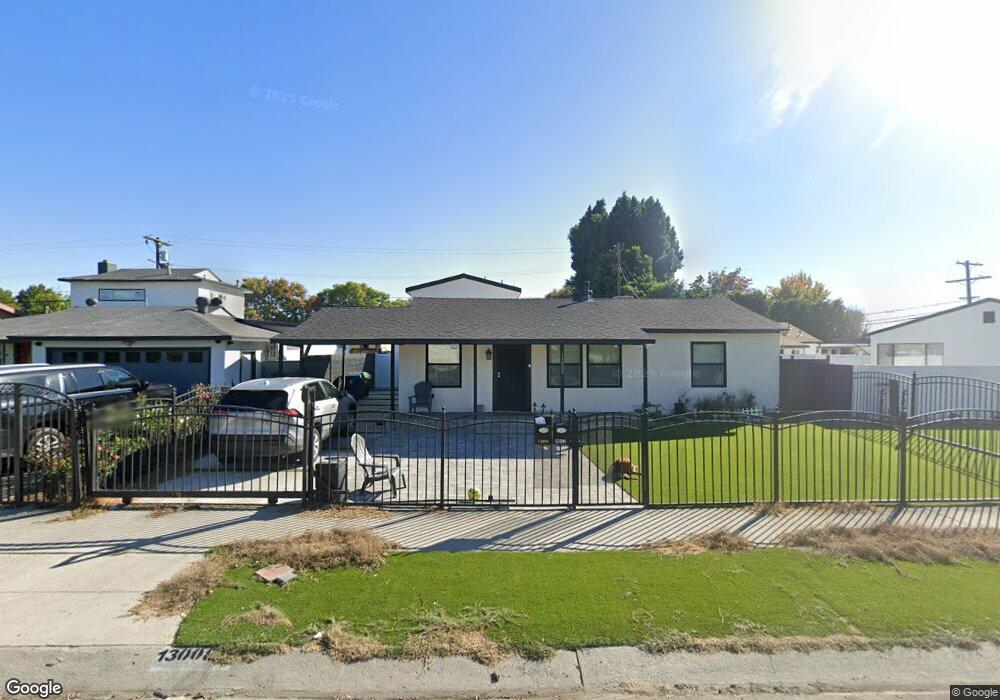
13008 Archwood St North Hollywood, CA 91606
North Hollywood NeighborhoodEstimated Value: $848,000 - $1,105,000
3
Beds
2
Baths
1,221
Sq Ft
$778/Sq Ft
Est. Value
About This Home
This home is located at 13008 Archwood St, North Hollywood, CA 91606 and is currently estimated at $949,552, approximately $777 per square foot. 13008 Archwood St is a home located in Los Angeles County with nearby schools including Coldwater Canyon Elementary, James Madison Middle, and Ulysses S. Grant Senior High School.
Ownership History
Date
Name
Owned For
Owner Type
Purchase Details
Closed on
Jun 19, 2020
Sold by
Maditsi Rachel M
Bought by
Maditsi Rachel M and Elkraif Daniel
Current Estimated Value
Purchase Details
Closed on
Aug 5, 2005
Sold by
Elkrias Shlomo
Bought by
Maditsi Rachel M
Home Financials for this Owner
Home Financials are based on the most recent Mortgage that was taken out on this home.
Original Mortgage
$412,000
Outstanding Balance
$218,401
Interest Rate
6%
Mortgage Type
Balloon
Estimated Equity
$731,151
Purchase Details
Closed on
Jul 18, 2005
Sold by
Abrahami Nitza Yehudai and Revocable Living Tr Samuel & N
Bought by
Maditsi Rachel M
Home Financials for this Owner
Home Financials are based on the most recent Mortgage that was taken out on this home.
Original Mortgage
$412,000
Outstanding Balance
$218,401
Interest Rate
6%
Mortgage Type
Balloon
Estimated Equity
$731,151
Purchase Details
Closed on
Dec 23, 2002
Sold by
Yehudai Nitza
Bought by
Abrahami Nitza Yehudai and Revocable Living Trust Of Samuel & Nitza
Create a Home Valuation Report for This Property
The Home Valuation Report is an in-depth analysis detailing your home's value as well as a comparison with similar homes in the area
Home Values in the Area
Average Home Value in this Area
Purchase History
| Date | Buyer | Sale Price | Title Company |
|---|---|---|---|
| Maditsi Rachel M | -- | Accommodation | |
| Maditsi Rachel M | -- | Alliance Title Company | |
| Maditsi Rachel M | $515,000 | Alliance Title | |
| Abrahami Nitza Yehudai | -- | -- |
Source: Public Records
Mortgage History
| Date | Status | Borrower | Loan Amount |
|---|---|---|---|
| Open | Maditsi Rachel M | $412,000 |
Source: Public Records
Tax History Compared to Growth
Tax History
| Year | Tax Paid | Tax Assessment Tax Assessment Total Assessment is a certain percentage of the fair market value that is determined by local assessors to be the total taxable value of land and additions on the property. | Land | Improvement |
|---|---|---|---|---|
| 2025 | $12,507 | $703,774 | $563,024 | $140,750 |
| 2024 | $12,507 | $689,976 | $551,985 | $137,991 |
| 2023 | $12,343 | $676,448 | $541,162 | $135,286 |
| 2022 | $11,944 | $663,185 | $530,551 | $132,634 |
| 2021 | $11,846 | $650,183 | $520,149 | $130,034 |
| 2020 | $11,925 | $643,517 | $514,816 | $128,701 |
| 2019 | $11,611 | $630,900 | $504,722 | $126,178 |
| 2018 | $11,223 | $596,000 | $477,000 | $119,000 |
| 2016 | $9,746 | $476,000 | $380,500 | $95,500 |
| 2015 | $5,801 | $476,000 | $380,500 | $95,500 |
| 2014 | $5,208 | $416,000 | $332,500 | $83,500 |
Source: Public Records
Map
Nearby Homes
- 12938 Vanowen St
- 6738 Coldwater Canyon Ave
- 13015 Vanowen St
- 13061 Vanowen St
- 13127 Hartland St
- 13211 Vanowen St Unit 9
- 13226 Vanowen St
- 6535 Mary Ellen Ave
- 6850 Longridge Ave
- 6654 Bellaire Ave
- 6828 Fulton Ave
- 7020 Mary Ellen Ave
- 6818 Varna Ave
- 6342 Morse Ave Unit 207
- 6342 Morse Ave Unit 205
- 7060 Morse Ave
- 6259 Coldwater Canyon Ave Unit 13
- 6259 Coldwater Canyon Ave Unit 33
- 12715 Hart St
- 7107 Coldwater Canyon Ave
- 13002 Archwood St
- 13016 Archwood St
- 13007 Lemay St
- 13013 Lemay St
- 13001 Lemay St
- 12962 Archwood St
- 13007 Archwood St
- 12961 Lemay St
- 13013 Archwood St
- 13001 Archwood St
- 12956 Archwood St
- 12961 Archwood St
- 13021 Archwood St
- 12955 Lemay St
- 12950 Archwood St
- 12955 Archwood St
- 6663 Morse Ave
- 6657 Morse Ave
- 13008 Lemay St
- 13012 Welby Way