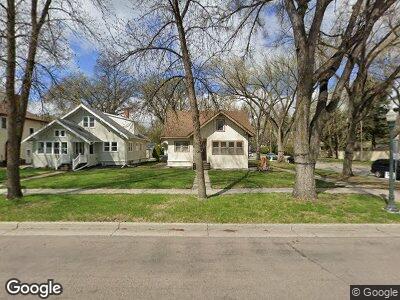
1301 8th St S Fargo, ND 58103
Clara Barton NeighborhoodEstimated Value: $356,000 - $387,572
--
Bed
--
Bath
2,009
Sq Ft
$185/Sq Ft
Est. Value
About This Home
This home is located at 1301 8th St S, Fargo, ND 58103 and is currently estimated at $371,786, approximately $185 per square foot. 1301 8th St S is a home located in Cass County with nearby schools including Clara Barton Elementary School, Carl Ben Eielson Middle School, and South High School.
Ownership History
Date
Name
Owned For
Owner Type
Purchase Details
Closed on
Jan 29, 2019
Sold by
Lake Agassiz Habitat For Humanity Inc
Bought by
Moore Winter
Current Estimated Value
Home Financials for this Owner
Home Financials are based on the most recent Mortgage that was taken out on this home.
Original Mortgage
$123,900
Outstanding Balance
$111,481
Interest Rate
4.6%
Mortgage Type
Commercial
Estimated Equity
$239,414
Purchase Details
Closed on
Jan 8, 2008
Sold by
Elmer Bruns Janpaul Apartments
Bought by
Lcher George and Lcher Paulette
Purchase Details
Closed on
Sep 28, 2005
Sold by
Dotzenrod James A
Bought by
Lacher George and Bruns Elmer
Home Financials for this Owner
Home Financials are based on the most recent Mortgage that was taken out on this home.
Original Mortgage
$46,745
Interest Rate
5.88%
Mortgage Type
New Conventional
Create a Home Valuation Report for This Property
The Home Valuation Report is an in-depth analysis detailing your home's value as well as a comparison with similar homes in the area
Home Values in the Area
Average Home Value in this Area
Purchase History
| Date | Buyer | Sale Price | Title Company |
|---|---|---|---|
| Moore Winter | $250,000 | Title Co | |
| Lcher George | -- | -- | |
| Lacher George | -- | -- |
Source: Public Records
Mortgage History
| Date | Status | Borrower | Loan Amount |
|---|---|---|---|
| Open | Moore Winter | $123,900 | |
| Previous Owner | Longtin Stuart J | $100,000 | |
| Previous Owner | Longtin Staurt J | $47,250 | |
| Previous Owner | Longtin Stuart J | $74,469 | |
| Previous Owner | Longtin Stuart J | $100,000 | |
| Previous Owner | Longtin Stuart J | $75,000 | |
| Previous Owner | Longtin Stuart J | $46,745 |
Source: Public Records
Tax History Compared to Growth
Tax History
| Year | Tax Paid | Tax Assessment Tax Assessment Total Assessment is a certain percentage of the fair market value that is determined by local assessors to be the total taxable value of land and additions on the property. | Land | Improvement |
|---|---|---|---|---|
| 2024 | $5,093 | $170,550 | $37,150 | $133,400 |
| 2023 | $4,975 | $148,300 | $37,150 | $111,150 |
| 2022 | $4,961 | $145,400 | $37,150 | $108,250 |
| 2021 | $5,347 | $162,550 | $33,650 | $128,900 |
| 2020 | $4,901 | $147,750 | $33,650 | $114,100 |
| 2019 | $4,519 | $133,100 | $21,200 | $111,900 |
| 2018 | $3,841 | $108,750 | $21,200 | $87,550 |
| 2017 | $3,732 | $105,700 | $21,200 | $84,500 |
| 2016 | $3,251 | $94,850 | $21,200 | $73,650 |
| 2015 | $3,400 | $94,850 | $13,100 | $81,750 |
| 2014 | $3,475 | $95,400 | $13,100 | $82,300 |
| 2013 | $3,609 | $95,400 | $13,100 | $82,300 |
Source: Public Records
Map
Nearby Homes