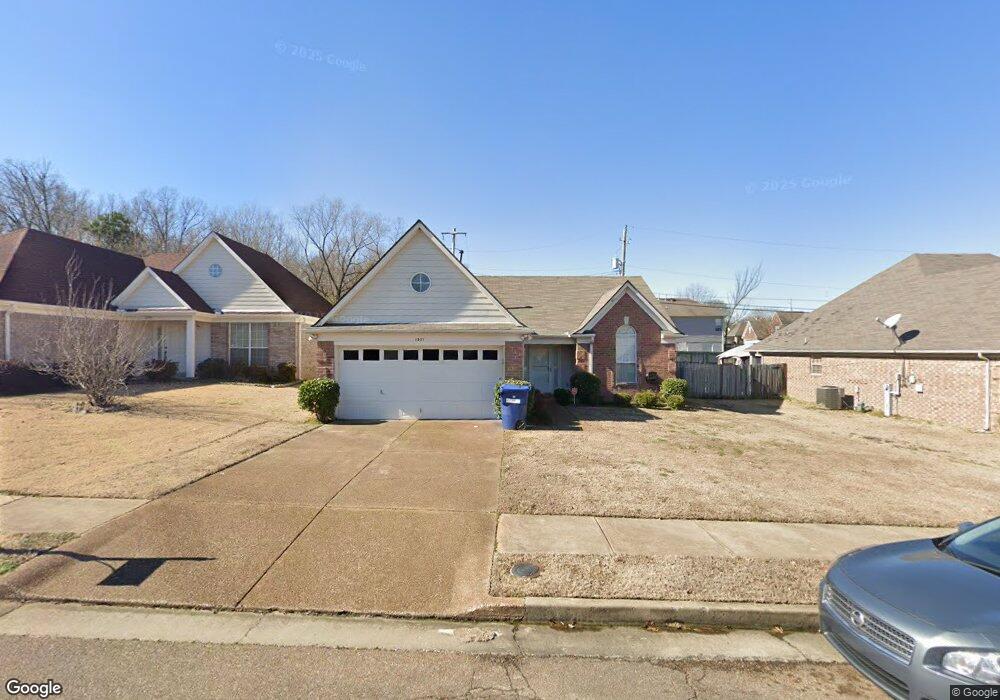
1301 Chatman Way Cordova, TN 38018
Cordova NeighborhoodEstimated Value: $221,000 - $249,000
3
Beds
2
Baths
1,434
Sq Ft
$165/Sq Ft
Est. Value
About This Home
This home is located at 1301 Chatman Way, Cordova, TN 38018 and is currently estimated at $237,137, approximately $165 per square foot. 1301 Chatman Way is a home located in Shelby County with nearby schools including Dexter Elementary School, Dexter Middle School, and Cordova High School.
Ownership History
Date
Name
Owned For
Owner Type
Purchase Details
Closed on
Sep 5, 2006
Sold by
Prudential Relocation Inc
Bought by
Phillips Latisha
Current Estimated Value
Home Financials for this Owner
Home Financials are based on the most recent Mortgage that was taken out on this home.
Original Mortgage
$25,780
Outstanding Balance
$15,482
Interest Rate
6.67%
Mortgage Type
Stand Alone Second
Estimated Equity
$221,655
Purchase Details
Closed on
Sep 1, 2006
Sold by
Huggans Sean A
Bought by
Prudential Relocation Inc
Home Financials for this Owner
Home Financials are based on the most recent Mortgage that was taken out on this home.
Original Mortgage
$25,780
Outstanding Balance
$15,482
Interest Rate
6.67%
Mortgage Type
Stand Alone Second
Estimated Equity
$221,655
Purchase Details
Closed on
Aug 27, 2002
Sold by
Sovereign Homes Llc
Bought by
Huggans Sean A
Home Financials for this Owner
Home Financials are based on the most recent Mortgage that was taken out on this home.
Original Mortgage
$130,469
Interest Rate
6.31%
Mortgage Type
FHA
Create a Home Valuation Report for This Property
The Home Valuation Report is an in-depth analysis detailing your home's value as well as a comparison with similar homes in the area
Home Values in the Area
Average Home Value in this Area
Purchase History
| Date | Buyer | Sale Price | Title Company |
|---|---|---|---|
| Phillips Latisha | $128,900 | Assured Escrow & Title | |
| Prudential Relocation Inc | $128,900 | Assures Escrow & Title | |
| Huggans Sean A | $131,500 | Memphis Title Company |
Source: Public Records
Mortgage History
| Date | Status | Borrower | Loan Amount |
|---|---|---|---|
| Open | Phillips Latisha | $25,780 | |
| Open | Prudential Relocation Inc | $103,120 | |
| Previous Owner | Huggans Sean A | $130,469 |
Source: Public Records
Tax History Compared to Growth
Tax History
| Year | Tax Paid | Tax Assessment Tax Assessment Total Assessment is a certain percentage of the fair market value that is determined by local assessors to be the total taxable value of land and additions on the property. | Land | Improvement |
|---|---|---|---|---|
| 2025 | $1,392 | $63,150 | $8,750 | $54,400 |
| 2024 | $1,392 | $41,050 | $6,875 | $34,175 |
| 2023 | $1,392 | $41,050 | $6,875 | $34,175 |
| 2022 | $1,392 | $41,050 | $6,875 | $34,175 |
| 2021 | $1,416 | $41,050 | $6,875 | $34,175 |
| 2020 | $1,218 | $30,075 | $6,875 | $23,200 |
| 2019 | $1,218 | $30,075 | $6,875 | $23,200 |
| 2018 | $1,218 | $30,075 | $6,875 | $23,200 |
| 2017 | $1,236 | $30,075 | $6,875 | $23,200 |
| 2016 | $1,221 | $27,950 | $0 | $0 |
| 2014 | $1,221 | $27,950 | $0 | $0 |
Source: Public Records
Map
Nearby Homes
- 7194 Charlton Way
- 1382 Exbury Dr
- 7412 Lost Trail Dr
- 7426 Lost Trail Dr
- 7404 Appling Rain Dr
- 7410 Appling Rain Dr
- 7035 S Estacada Way
- 7407 Lost Grove Ln
- 7520 Crystal Lake Dr
- 1321 Winter Springs Ln
- 1277 Winter Springs Ln
- 1089 Links View Ln W
- 7468 Links View Ln S
- 1520 Cider House Ln
- 6916 Lagrange Pines Rd
- 7494 Links View Ln S
- 7565 Wintergreen Ln
- 1595 Dexter Grove Ct Unit E105
- 1595 Dexter Grove Ct Unit D101
- 6838 Lagrange Cir N
- 1295 Chatman Way
- 1303 Chatman Way
- 1296 Hazel Crest Ln
- 1304 Hazel Crest Ln
- 1296 Chatman Way
- 1285 Chatman Way
- 1304 Chatman Way
- 1315 Chatman Cove
- 1290 Chatman Way
- 1279 Chatman Way
- 1286 Chatman Way
- 1318 Hazel Crest Ln
- 1316 Chatman Cove
- 1321 Chatman Cove
- 1280 Chatman Way
- 7209 Amberly Way Dr
- 7267 Amberly Way Dr
- 1322 Hazel Crest Ln
- 1271 Chatman Way