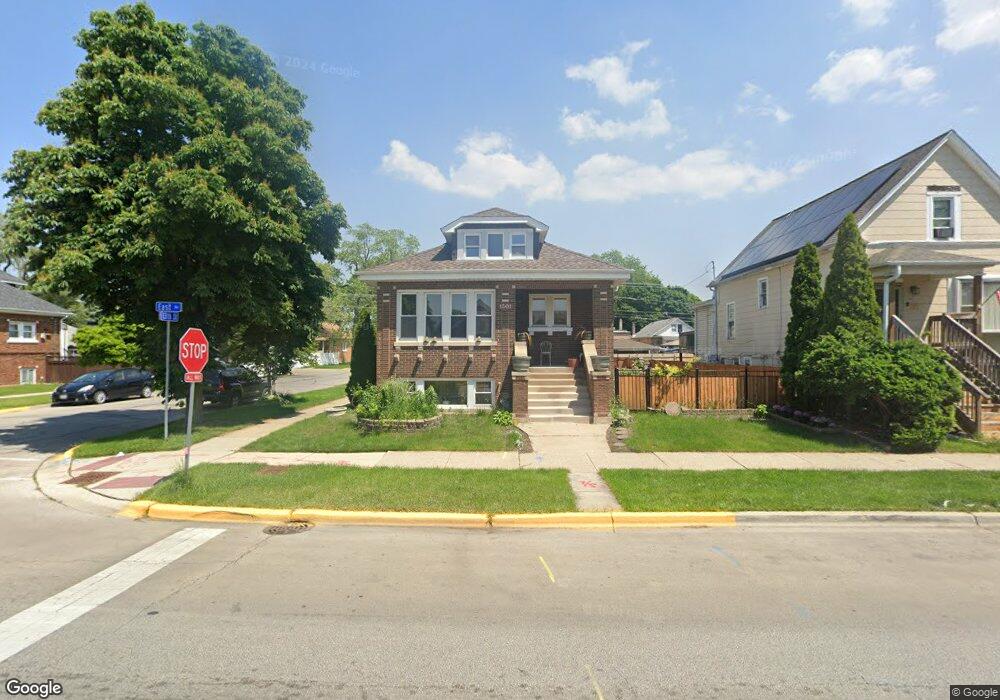
1301 East Ave Berwyn, IL 60402
Estimated Value: $416,000 - $482,602
4
Beds
3
Baths
2,198
Sq Ft
$204/Sq Ft
Est. Value
About This Home
This home is located at 1301 East Ave, Berwyn, IL 60402 and is currently estimated at $448,534, approximately $204 per square foot. 1301 East Ave is a home located in Cook County with nearby schools including Prairie Oak School, Lincoln Middle School, and J. Sterling Morton High School West.
Ownership History
Date
Name
Owned For
Owner Type
Purchase Details
Closed on
Aug 21, 2024
Sold by
Deleon Sara and Sandoval Margarito
Bought by
Dk 0610 Trust and De Leon
Current Estimated Value
Purchase Details
Closed on
Sep 5, 2002
Sold by
Hud
Bought by
Sandoval Margarito and Sandoval Sara
Home Financials for this Owner
Home Financials are based on the most recent Mortgage that was taken out on this home.
Original Mortgage
$137,600
Interest Rate
8.05%
Purchase Details
Closed on
Aug 7, 2001
Sold by
Espino
Bought by
Hud
Purchase Details
Closed on
Oct 6, 1998
Sold by
Tisinai Joseph J
Bought by
Reichardt Penelope
Purchase Details
Closed on
Nov 16, 1995
Sold by
Grim Charles S and Grim Laurie A
Bought by
Espino Juan and Rodriguez Mary
Home Financials for this Owner
Home Financials are based on the most recent Mortgage that was taken out on this home.
Original Mortgage
$121,984
Interest Rate
7.52%
Mortgage Type
FHA
Create a Home Valuation Report for This Property
The Home Valuation Report is an in-depth analysis detailing your home's value as well as a comparison with similar homes in the area
Home Values in the Area
Average Home Value in this Area
Purchase History
| Date | Buyer | Sale Price | Title Company |
|---|---|---|---|
| Dk 0610 Trust | -- | None Listed On Document | |
| Sandoval Margarito | -- | -- | |
| Hud | -- | -- | |
| Reichardt Penelope | $89,500 | -- | |
| Espino Juan | $123,000 | -- |
Source: Public Records
Mortgage History
| Date | Status | Borrower | Loan Amount |
|---|---|---|---|
| Previous Owner | Sandoval Margarito | $137,600 | |
| Previous Owner | Espino Juan | $121,984 |
Source: Public Records
Tax History Compared to Growth
Tax History
| Year | Tax Paid | Tax Assessment Tax Assessment Total Assessment is a certain percentage of the fair market value that is determined by local assessors to be the total taxable value of land and additions on the property. | Land | Improvement |
|---|---|---|---|---|
| 2024 | $10,905 | $38,001 | $7,088 | $30,913 |
| 2023 | $7,531 | $38,001 | $7,088 | $30,913 |
| 2022 | $7,531 | $22,212 | $6,143 | $16,069 |
| 2021 | $7,207 | $22,211 | $6,142 | $16,069 |
| 2020 | $7,103 | $22,211 | $6,142 | $16,069 |
| 2019 | $6,543 | $19,293 | $5,512 | $13,781 |
| 2018 | $6,283 | $19,293 | $5,512 | $13,781 |
| 2017 | $7,411 | $22,676 | $5,512 | $17,164 |
| 2016 | $5,310 | $15,051 | $4,567 | $10,484 |
| 2015 | $5,158 | $15,051 | $4,567 | $10,484 |
| 2014 | $5,036 | $15,051 | $4,567 | $10,484 |
| 2013 | $6,007 | $19,377 | $4,567 | $14,810 |
Source: Public Records
Map
Nearby Homes
- 1321 East Ave
- 1335 Wesley Ave
- 1243 Elmwood Ave
- 1435 Gunderson Ave
- 1183 S Scoville Ave
- 1510 Scoville Ave
- 1223 S Elmwood Ave Unit TWO
- 1336 Cuyler Ave
- 1156 Wesley Ave
- 6337 Roosevelt Rd Unit 309
- 6337 Roosevelt Rd Unit 103
- 1413 Cuyler Ave
- 1442 Oak Park Ave
- 1336 Grove Ave
- 1125 Gunderson Ave
- 1618 Scoville Ave
- 1341 Kenilworth Ave
- 1133 S Ridgeland Ave
- 1523 Cuyler Ave
- 1631 Clarence Ave
- 1309 East Ave
- 1247 East Ave
- 1313 East Ave
- 1302 Scoville Ave
- 1245 East Ave
- 1306 Scoville Ave
- 1310 Scoville Ave
- 1241 East Ave
- 1312 Scoville Ave
- 1248 Scoville Ave
- 1317 East Ave Unit 2
- 1317 East Ave Unit 3
- 1317 East Ave Unit 1
- 1317 East Ave
- 1300 East Ave
- 1302 East Ave
- 1304 East Ave
- 1314 Scoville Ave
- 1244 Scoville Ave
- 1308 East Ave