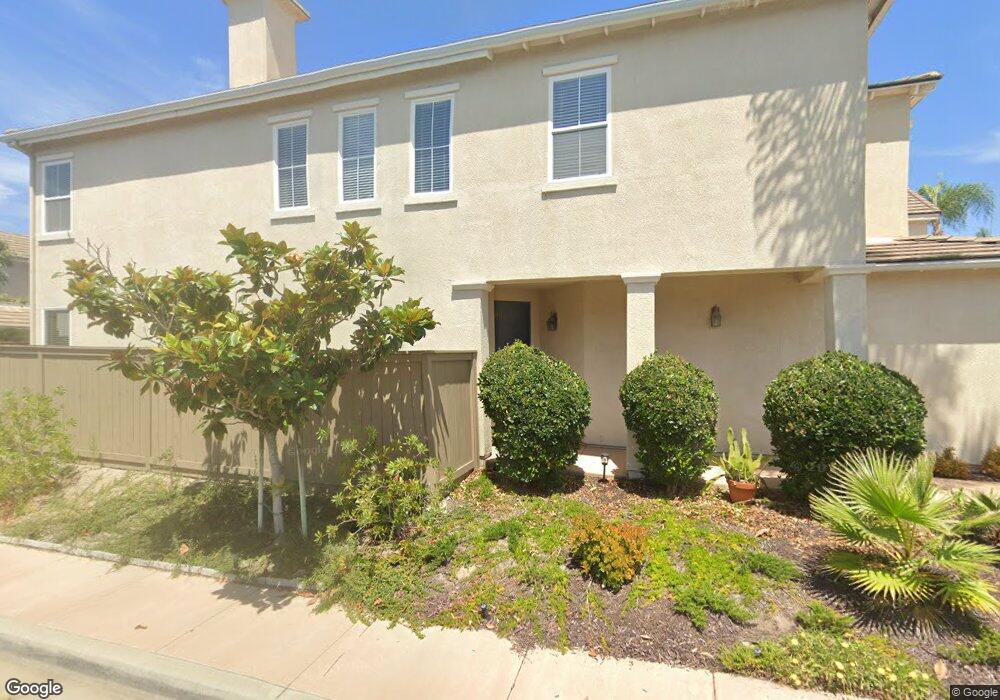
1301 Enchante Way Oceanside, CA 92056
Ivey Ranch-Rancho Del Oro NeighborhoodEstimated Value: $919,501 - $994,000
3
Beds
3
Baths
2,227
Sq Ft
$431/Sq Ft
Est. Value
About This Home
This home is located at 1301 Enchante Way, Oceanside, CA 92056 and is currently estimated at $958,875, approximately $430 per square foot. 1301 Enchante Way is a home located in San Diego County with nearby schools including Ivey Ranch Elementary School, Martin Luther King Jr. Middle School, and El Camino High School.
Ownership History
Date
Name
Owned For
Owner Type
Purchase Details
Closed on
Apr 24, 2017
Sold by
Zickert Poulos Colleen M
Bought by
Zickert Poulos Colleen M
Current Estimated Value
Purchase Details
Closed on
Dec 3, 2002
Sold by
Zickert Poulos Colleen M and Poulos George
Bought by
Poulos George and Zickert Poulos Colleen M
Home Financials for this Owner
Home Financials are based on the most recent Mortgage that was taken out on this home.
Original Mortgage
$278,800
Outstanding Balance
$120,102
Interest Rate
6.28%
Estimated Equity
$838,773
Purchase Details
Closed on
Jul 31, 2001
Sold by
D R Horton San Diego Holding Company Inc
Bought by
Poulos George and Zickert Poulos Colleen M
Home Financials for this Owner
Home Financials are based on the most recent Mortgage that was taken out on this home.
Original Mortgage
$243,128
Interest Rate
7.09%
Create a Home Valuation Report for This Property
The Home Valuation Report is an in-depth analysis detailing your home's value as well as a comparison with similar homes in the area
Home Values in the Area
Average Home Value in this Area
Purchase History
| Date | Buyer | Sale Price | Title Company |
|---|---|---|---|
| Zickert Poulos Colleen M | -- | None Available | |
| Poulos George | -- | Chicago Title Co | |
| Poulos George | $304,000 | Chicago Title |
Source: Public Records
Mortgage History
| Date | Status | Borrower | Loan Amount |
|---|---|---|---|
| Open | Poulos George | $278,800 | |
| Closed | Poulos George | $243,128 |
Source: Public Records
Tax History Compared to Growth
Tax History
| Year | Tax Paid | Tax Assessment Tax Assessment Total Assessment is a certain percentage of the fair market value that is determined by local assessors to be the total taxable value of land and additions on the property. | Land | Improvement |
|---|---|---|---|---|
| 2025 | $4,882 | $448,947 | $147,720 | $301,227 |
| 2024 | $4,882 | $440,145 | $144,824 | $295,321 |
| 2023 | $4,729 | $431,516 | $141,985 | $289,531 |
| 2022 | $4,656 | $423,055 | $139,201 | $283,854 |
| 2021 | $4,673 | $414,761 | $136,472 | $278,289 |
| 2020 | $4,528 | $410,509 | $135,073 | $275,436 |
| 2019 | $4,395 | $402,461 | $132,425 | $270,036 |
| 2018 | $4,347 | $394,571 | $129,829 | $264,742 |
| 2017 | $4,266 | $386,835 | $127,284 | $259,551 |
| 2016 | $4,126 | $379,251 | $124,789 | $254,462 |
| 2015 | $4,004 | $373,555 | $122,915 | $250,640 |
| 2014 | -- | $366,239 | $120,508 | $245,731 |
Source: Public Records
Map
Nearby Homes
- 4620 Los Alamos Way Unit D
- 1275 Natoma Way Unit B
- 508 Dakota Way
- 1267 Via Lucero
- 4384 Nautilus Way Unit 8
- 1018 Plover Way
- 1137 Avenida Sobrina
- 1024 Eider Way
- 4372 Pacifica Way Unit 6
- 4395 Albatross Way
- 4321 Star Path Way Unit 3
- 4347 Harbor Way Unit 4
- 4964 Calle Sobrado
- 4369 Dowitcher Way
- 4428 Skimmer Way
- 4302 Pacifica Way Unit 2
- 942 Royal Tern Way
- 4402 Chickadee Way
- 4320 Black Duck Way
- 4082 Ivey Vista Way
- 1305 Enchante Way
- 4604 Partow Way
- 1511 Enchante Way
- 1313 Enchante Way
- 1321 Enchante Way
- 1507 Enchante Way
- 4608 Partow Way
- 4625 Partow Way
- 1327 Enchante Way
- 1300 Enchante Way
- 1503 Enchante Way
- 4612 Partow Way
- 4629 Partow Way
- 1508 Enchante Way
- 1304 Enchante Way
- 1335 Enchante Way
- 1499 Enchante Way
- 4633 Partow Way
- 4616 Partow Way
- 1308 Enchante Way