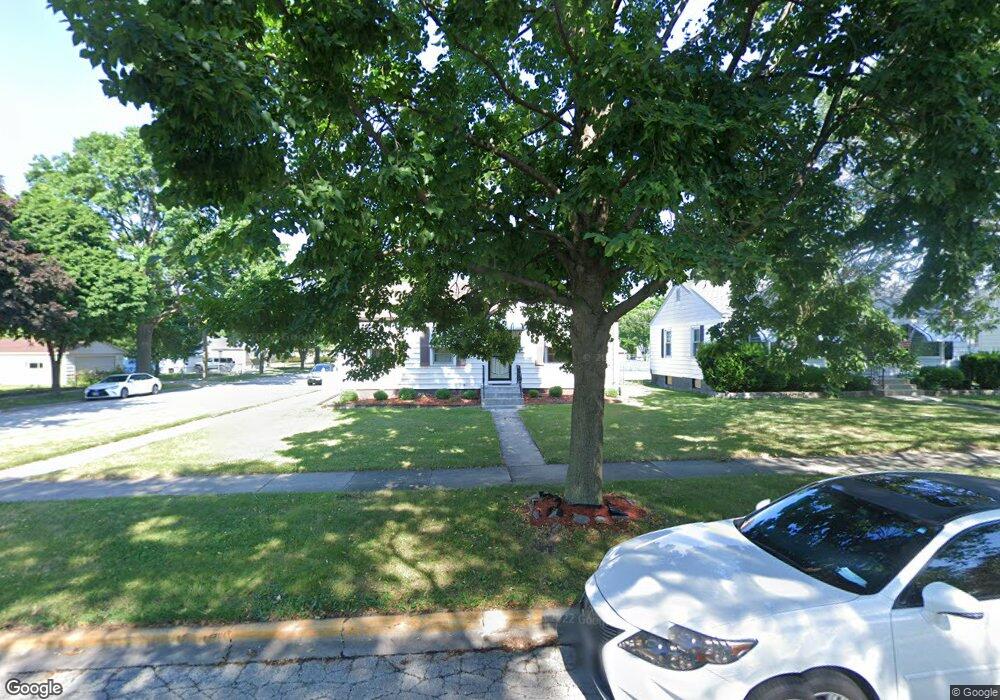
1301 Howard Ave Berkeley, IL 60163
Estimated Value: $253,743 - $285,000
3
Beds
1
Bath
900
Sq Ft
$301/Sq Ft
Est. Value
About This Home
This home is located at 1301 Howard Ave, Berkeley, IL 60163 and is currently estimated at $271,186, approximately $301 per square foot. 1301 Howard Ave is a home located in Cook County with nearby schools including Macarthur Intermediate School, Sunnyside Elementary School, and Proviso West High School.
Ownership History
Date
Name
Owned For
Owner Type
Purchase Details
Closed on
May 31, 2005
Sold by
Cunniff Jason J and Cunniff Alicia F
Bought by
Anjum Talath
Current Estimated Value
Home Financials for this Owner
Home Financials are based on the most recent Mortgage that was taken out on this home.
Original Mortgage
$160,700
Outstanding Balance
$84,988
Interest Rate
6.37%
Mortgage Type
Unknown
Estimated Equity
$186,198
Purchase Details
Closed on
Aug 28, 2000
Sold by
Andres Glenn E and Andres Kathryn C
Bought by
Cunniff Jason J and Cunniff Alicia E
Home Financials for this Owner
Home Financials are based on the most recent Mortgage that was taken out on this home.
Original Mortgage
$134,106
Interest Rate
8.26%
Mortgage Type
FHA
Create a Home Valuation Report for This Property
The Home Valuation Report is an in-depth analysis detailing your home's value as well as a comparison with similar homes in the area
Home Values in the Area
Average Home Value in this Area
Purchase History
| Date | Buyer | Sale Price | Title Company |
|---|---|---|---|
| Anjum Talath | $201,000 | First American Title | |
| Cunniff Jason J | $136,000 | -- |
Source: Public Records
Mortgage History
| Date | Status | Borrower | Loan Amount |
|---|---|---|---|
| Open | Anjum Talath | $160,700 | |
| Previous Owner | Cunniff Jason J | $134,106 |
Source: Public Records
Tax History
| Year | Tax Paid | Tax Assessment Tax Assessment Total Assessment is a certain percentage of the fair market value that is determined by local assessors to be the total taxable value of land and additions on the property. | Land | Improvement |
|---|---|---|---|---|
| 2025 | $6,494 | $20,841 | $3,950 | $16,891 |
| 2024 | $6,494 | $20,841 | $3,950 | $16,891 |
| 2023 | $6,065 | $20,841 | $3,950 | $16,891 |
| 2022 | $6,065 | $17,226 | $2,693 | $14,533 |
| 2021 | $6,085 | $17,225 | $2,693 | $14,532 |
| 2020 | $5,966 | $17,548 | $2,693 | $14,855 |
| 2019 | $3,973 | $12,803 | $2,513 | $10,290 |
| 2018 | $3,893 | $12,803 | $2,513 | $10,290 |
| 2017 | $3,745 | $12,803 | $2,513 | $10,290 |
| 2016 | $3,391 | $10,875 | $2,334 | $8,541 |
| 2015 | $3,331 | $10,875 | $2,334 | $8,541 |
| 2014 | $3,292 | $10,875 | $2,334 | $8,541 |
| 2013 | $3,644 | $12,581 | $2,334 | $10,247 |
Source: Public Records
Map
Nearby Homes
- 5700 Saint Charles Rd
- 5706 Saint Charles Rd
- 1428 1/2 N Ashbel Ave
- 1447 N Ashbel Ave
- 1529 N Hillside Ave
- 1038 Arthur Ave
- 4904 W Hawthorne Ave
- 4938 W Randolph St
- 768 N Rohde Ave
- 1463 Speechley Blvd
- 605 N Wolf Rd Unit B9
- 504 N Irving Ave
- 51 50th Ave
- 5949 School St
- 520 N Wolf Rd Unit 203
- 515 S Parkview Ave
- 33 49th Ave
- 129 49th Ave
- 593 S Edgewood Ave
- 47 48th Ave
- 1305 Howard Ave
- 1309 Howard Ave
- 1245 Howard Ave
- 1300 N Irving Ave
- 1304 N Irving Ave
- 1313 Howard Ave
- 1241 Howard Ave
- 1308 N Irving Ave
- 1244 N Irving Ave
- 1300 Howard Ave
- 1304 Howard Ave
- 1312 N Irving Ave
- 1240 N Irving Ave
- 1308 Howard Ave
- 1317 Howard Ave
- 1237 Howard Ave
- 1244 Howard Ave
- 1312 Howard Ave
- 1236 N Irving Ave
- 1316 N Irving Ave
Your Personal Tour Guide
Ask me questions while you tour the home.