1301 Kondos Ave Sacramento, CA 95814
Downtown Sacramento NeighborhoodEstimated Value: $572,000 - $858,000
3
Beds
4
Baths
1,609
Sq Ft
$452/Sq Ft
Est. Value
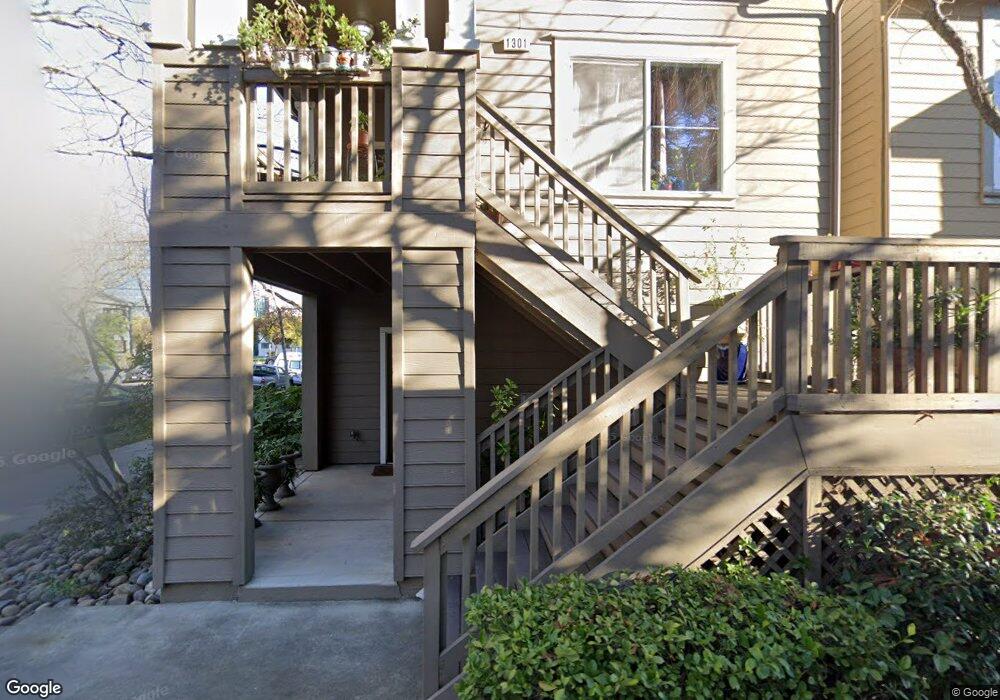
About This Home
This home is located at 1301 Kondos Ave, Sacramento, CA 95814 and is currently estimated at $727,842, approximately $452 per square foot. 1301 Kondos Ave is a home located in Sacramento County with nearby schools including William Land Elementary School, Miwok Middle School, and C. K. McClatchy High.
Ownership History
Date
Name
Owned For
Owner Type
Purchase Details
Closed on
Aug 21, 2002
Sold by
Meidam Frederick J and Meidam Miriam E
Bought by
Zehender G W and The G W Zehender Declaration O
Current Estimated Value
Purchase Details
Closed on
Apr 7, 2002
Sold by
Shasta/Downtown Single Family Developmen
Bought by
Meidam Frederick J and Meidam Miriam E
Home Financials for this Owner
Home Financials are based on the most recent Mortgage that was taken out on this home.
Original Mortgage
$223,950
Interest Rate
6.78%
Create a Home Valuation Report for This Property
The Home Valuation Report is an in-depth analysis detailing your home's value as well as a comparison with similar homes in the area
Home Values in the Area
Average Home Value in this Area
Purchase History
| Date | Buyer | Sale Price | Title Company |
|---|---|---|---|
| Zehender G W | $380,000 | Stewart Title | |
| Meidam Frederick J | $280,000 | Stewart Title |
Source: Public Records
Mortgage History
| Date | Status | Borrower | Loan Amount |
|---|---|---|---|
| Previous Owner | Meidam Frederick J | $223,950 |
Source: Public Records
Tax History Compared to Growth
Tax History
| Year | Tax Paid | Tax Assessment Tax Assessment Total Assessment is a certain percentage of the fair market value that is determined by local assessors to be the total taxable value of land and additions on the property. | Land | Improvement |
|---|---|---|---|---|
| 2025 | $6,530 | $550,195 | $57,921 | $492,274 |
| 2024 | $6,530 | $539,408 | $56,786 | $482,622 |
| 2023 | $6,377 | $528,832 | $55,673 | $473,159 |
| 2022 | $6,271 | $518,464 | $54,582 | $463,882 |
| 2021 | $5,975 | $508,299 | $53,512 | $454,787 |
| 2020 | $6,025 | $503,088 | $52,964 | $450,124 |
| 2019 | $5,898 | $493,225 | $51,926 | $441,299 |
| 2018 | $5,745 | $483,555 | $50,908 | $432,647 |
| 2017 | $5,668 | $474,074 | $49,910 | $424,164 |
| 2016 | $4,827 | $406,031 | $42,748 | $363,283 |
| 2015 | $4,483 | $375,956 | $39,582 | $336,374 |
| 2014 | $4,403 | $372,234 | $39,190 | $333,044 |
Source: Public Records
Map
Nearby Homes