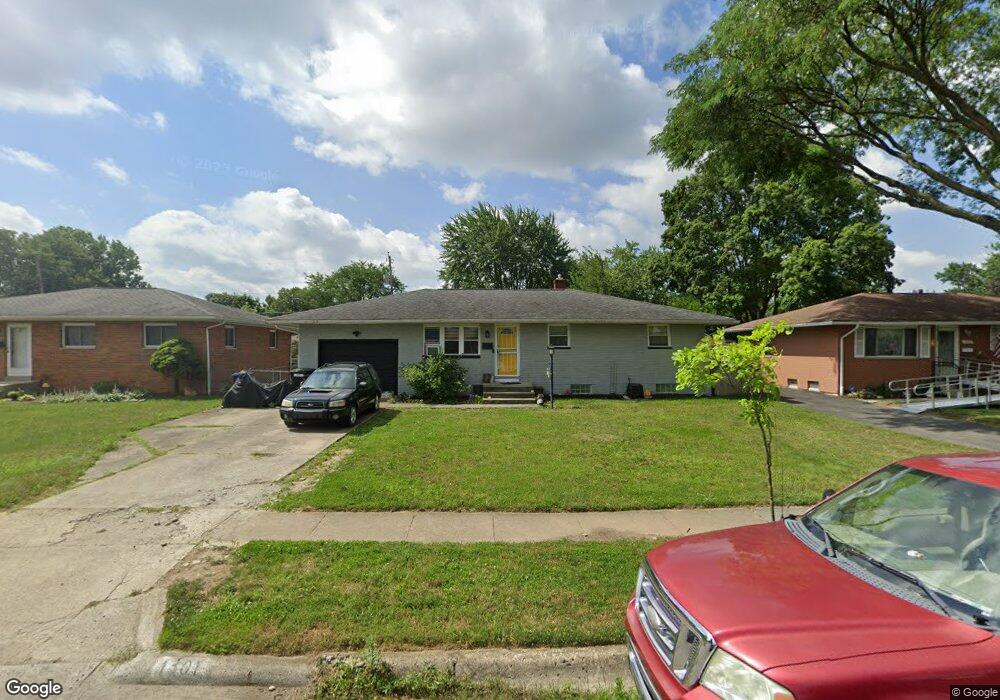
1301 Pershing Dr Columbus, OH 43224
Clinton Estates NeighborhoodEstimated Value: $192,000 - $259,000
3
Beds
1
Bath
1,131
Sq Ft
$201/Sq Ft
Est. Value
About This Home
This home is located at 1301 Pershing Dr, Columbus, OH 43224 and is currently estimated at $226,922, approximately $200 per square foot. 1301 Pershing Dr is a home located in Franklin County with nearby schools including Maize Road Elementary School, Medina Middle School, and Mifflin High School.
Ownership History
Date
Name
Owned For
Owner Type
Purchase Details
Closed on
Jan 9, 2026
Sold by
Dehorta Grace and De Horta Brandon
Bought by
Dehorta Brandon
Current Estimated Value
Home Financials for this Owner
Home Financials are based on the most recent Mortgage that was taken out on this home.
Original Mortgage
$110,547
Outstanding Balance
$110,547
Interest Rate
6.19%
Mortgage Type
FHA
Estimated Equity
$116,375
Purchase Details
Closed on
Sep 20, 2016
Sold by
Eric Linghfalter and Malone Timothy
Bought by
Dehorta Brandon and Dehorta Grace
Home Financials for this Owner
Home Financials are based on the most recent Mortgage that was taken out on this home.
Original Mortgage
$70,000
Interest Rate
3.45%
Mortgage Type
New Conventional
Purchase Details
Closed on
Oct 30, 2009
Sold by
Lingafelter Wayne and Lingafelter Ruth
Bought by
Lingafelter Wayne and Lingafelter Eric
Purchase Details
Closed on
Jul 17, 1997
Sold by
Lingafelter Ruth G
Bought by
Lingafelter Ruth G and Lingafelter Wayne
Create a Home Valuation Report for This Property
The Home Valuation Report is an in-depth analysis detailing your home's value as well as a comparison with similar homes in the area
Home Values in the Area
Average Home Value in this Area
Purchase History
| Date | Buyer | Sale Price | Title Company |
|---|---|---|---|
| Dehorta Brandon | -- | Servicelink | |
| Dehorta Brandon | $90,000 | Northwest Title Family Of C | |
| Lingafelter Wayne | -- | Attorney | |
| Lingafelter Ruth G | -- | -- |
Source: Public Records
Mortgage History
| Date | Status | Borrower | Loan Amount |
|---|---|---|---|
| Open | Dehorta Brandon | $110,547 | |
| Previous Owner | Dehorta Brandon | $70,000 |
Source: Public Records
Tax History
| Year | Tax Paid | Tax Assessment Tax Assessment Total Assessment is a certain percentage of the fair market value that is determined by local assessors to be the total taxable value of land and additions on the property. | Land | Improvement |
|---|---|---|---|---|
| 2025 | $3,256 | $72,560 | $19,670 | $52,890 |
| 2024 | $3,256 | $72,560 | $19,670 | $52,890 |
| 2023 | $3,215 | $72,555 | $19,670 | $52,885 |
| 2022 | $2,424 | $46,730 | $8,540 | $38,190 |
| 2021 | $2,428 | $46,730 | $8,540 | $38,190 |
| 2020 | $2,431 | $46,730 | $8,540 | $38,190 |
| 2019 | $2,291 | $37,770 | $6,830 | $30,940 |
| 2018 | $2,140 | $37,770 | $6,830 | $30,940 |
| 2017 | $2,290 | $37,770 | $6,830 | $30,940 |
| 2016 | $2,196 | $33,150 | $6,650 | $26,500 |
| 2015 | $1,993 | $33,150 | $6,650 | $26,500 |
| 2014 | $1,998 | $33,150 | $6,650 | $26,500 |
| 2013 | $1,038 | $34,895 | $7,000 | $27,895 |
Source: Public Records
Map
Nearby Homes
- 4455 Kenfield Rd
- 1451 Merton Dr
- 4143 Karl Rd Unit 314
- 4145 Karl Rd Unit 223
- 1130 Carbone Dr
- 4827 Glendon Rd
- 1116 Tulsa Dr
- 4800 Bourke Rd
- 4815 Bourke Rd
- 1125 Upland Dr
- 4795 Colonel Perry Dr
- 1414 Alvina Dr
- 4904 Almont Dr
- 4508 Glenmawr Ave
- 4983 Almont Dr
- 4923 Karl Rd Unit 4925
- 1385 Thurell Rd
- 1637 Nestling Dr Unit 639
- 3941 Karl Rd Unit 326
- 3939 Karl Rd Unit 102
- 1293 Pershing Dr
- 1309 Pershing Dr
- 4534 Blythe Rd
- 1317 Pershing Dr
- 1296 Fowler Dr
- 1298 Fowler Dr
- 1288 Fowler Dr
- 1302 Pershing Dr
- 4516 Blythe Rd
- 1310 Pershing Dr
- 1300 Fowler Dr
- 1325 Pershing Dr
- 1294 Pershing Dr
- 1318 Pershing Dr
- 1286 Pershing Dr
- 1333 Pershing Dr
- 1326 Pershing Dr
- 1302 Fowler Dr
- 1278 Pershing Dr
- 1271 Pershing Dr