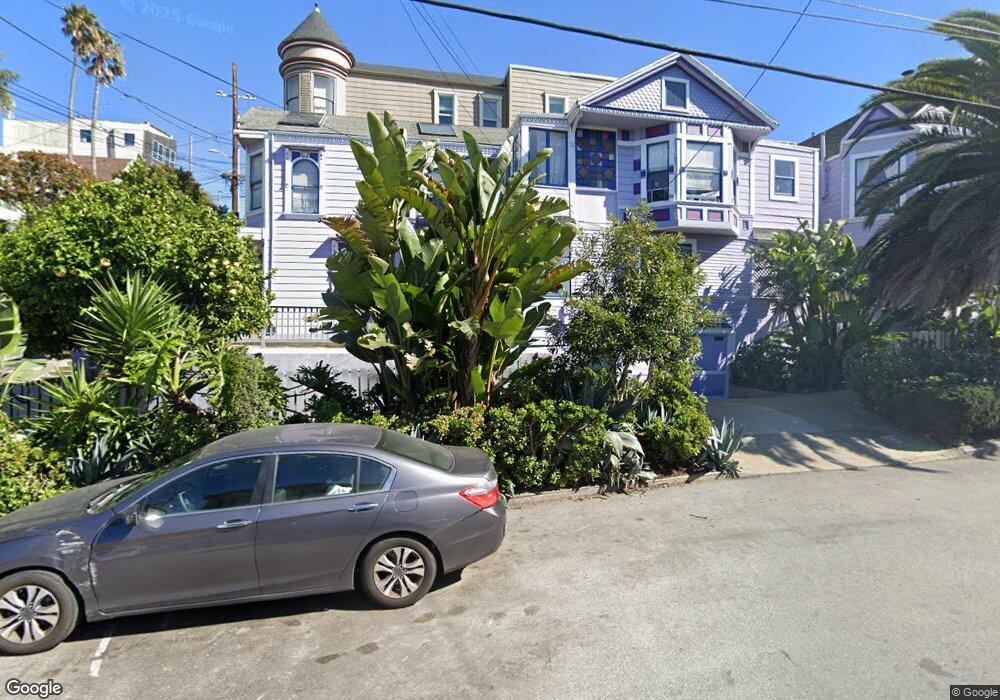
1301 Rhode Island St Unit 1303 San Francisco, CA 94107
Potrero NeighborhoodEstimated Value: $1,474,000 - $2,493,769
--
Bed
4
Baths
3,600
Sq Ft
$524/Sq Ft
Est. Value
About This Home
This home is located at 1301 Rhode Island St Unit 1303, San Francisco, CA 94107 and is currently estimated at $1,884,923, approximately $523 per square foot. 1301 Rhode Island St Unit 1303 is a home located in San Francisco County with nearby schools including Thomas Starr King Elementary School, Aptos Middle School, and Mission Preparatory.
Ownership History
Date
Name
Owned For
Owner Type
Purchase Details
Closed on
Dec 11, 2019
Sold by
Hundt Thomas M
Bought by
Hundt Thomas M and Chin Soo-Young
Current Estimated Value
Purchase Details
Closed on
Apr 9, 1998
Sold by
Western American Development Co Inc
Bought by
Hundt Thomas M
Home Financials for this Owner
Home Financials are based on the most recent Mortgage that was taken out on this home.
Original Mortgage
$476,000
Interest Rate
7.15%
Mortgage Type
Commercial
Purchase Details
Closed on
May 16, 1997
Sold by
Suying Foon and Lum Diane Lum
Bought by
Western American Development Co Inc
Home Financials for this Owner
Home Financials are based on the most recent Mortgage that was taken out on this home.
Original Mortgage
$7,000
Interest Rate
7.94%
Mortgage Type
Commercial
Create a Home Valuation Report for This Property
The Home Valuation Report is an in-depth analysis detailing your home's value as well as a comparison with similar homes in the area
Home Values in the Area
Average Home Value in this Area
Purchase History
| Date | Buyer | Sale Price | Title Company |
|---|---|---|---|
| Hundt Thomas M | -- | None Listed On Document | |
| Hundt Thomas M | $595,000 | Fidelity National Title Co | |
| Western American Development Co Inc | -- | Fidelity National Title Co |
Source: Public Records
Mortgage History
| Date | Status | Borrower | Loan Amount |
|---|---|---|---|
| Previous Owner | Hundt Thomas M | $476,000 | |
| Previous Owner | Western American Development Co Inc | $7,000 | |
| Closed | Hundt Thomas M | $59,500 |
Source: Public Records
Tax History Compared to Growth
Tax History
| Year | Tax Paid | Tax Assessment Tax Assessment Total Assessment is a certain percentage of the fair market value that is determined by local assessors to be the total taxable value of land and additions on the property. | Land | Improvement |
|---|---|---|---|---|
| 2025 | $12,214 | $950,058 | $479,020 | $471,038 |
| 2024 | $12,214 | $931,430 | $469,628 | $461,802 |
| 2023 | $11,895 | $913,168 | $460,420 | $452,748 |
| 2022 | $11,620 | $895,264 | $451,393 | $443,871 |
| 2021 | $11,419 | $877,711 | $442,543 | $435,168 |
| 2020 | $11,627 | $868,712 | $438,006 | $430,706 |
| 2019 | $11,165 | $851,679 | $429,418 | $422,261 |
| 2018 | $10,808 | $834,981 | $420,999 | $413,982 |
| 2017 | $10,386 | $818,610 | $412,745 | $405,865 |
| 2016 | $10,197 | $802,559 | $404,652 | $397,907 |
| 2015 | $10,066 | $790,505 | $398,574 | $391,931 |
| 2014 | $9,808 | $775,021 | $390,767 | $384,254 |
Source: Public Records
Map
Nearby Homes
- 1338 Rhode Island St
- 2250 24th St Unit 127
- 2225 23rd St Unit 214
- 1040 Wisconsin St
- 1145 Wisconsin St
- 19 Blair Terrace
- 1013 Rhode Island St
- 2023 22nd St
- 1354 Utah St Unit 1354
- 2119 22nd St
- 1002 Rhode Island St Unit 1
- 2603 23rd St
- 2758 23rd St
- 2758-2760 23rd St
- 1258 York St
- 1339-1341 York St
- 1222 York St Unit C
- 1222 York St Unit A
- 1104 York St
- 2920 25th St
- 2131 24th St
- 2129 24th St Unit 2129
- 2127 24th St Unit 2127
- 2125 24th St
- 1327 Rhode Island St Unit B
- 1333 Rhode Island St
- 1329 Rhode Island St
- 2121 24th St
- 1300 Rhode Island St
- 1300 Rhode Island St Unit 1302
- 1300 Rhode Island St Unit 2205
- 1330 Rhode Island St
- 1337 Rhode Island St
- 2119 24th St
- 2207 24th St
- 1345 Rhode Island St
- 2134 24th St
- 2132 24th St
- 1285 Rhode Island St
- 2107 24th St Unit 2109