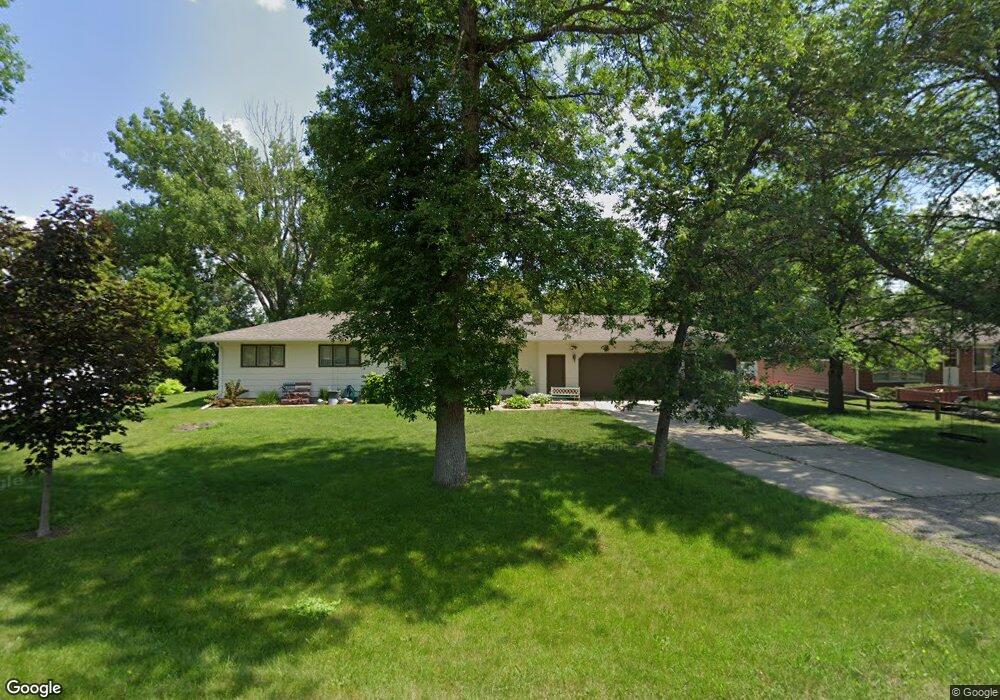
1301 River St West Fargo, ND 58078
Elmwood Court NeighborhoodEstimated Value: $279,000 - $380,000
3
Beds
3
Baths
1,360
Sq Ft
$238/Sq Ft
Est. Value
About This Home
This home is located at 1301 River St, West Fargo, ND 58078 and is currently estimated at $323,512, approximately $237 per square foot. 1301 River St is a home located in Cass County with nearby schools including South Elementary School, Cheney Middle School, and West Fargo High School.
Ownership History
Date
Name
Owned For
Owner Type
Purchase Details
Closed on
Jun 23, 2014
Sold by
Berglund Victoria A
Bought by
Moss Chelsey R and Moss Cassidy T
Current Estimated Value
Home Financials for this Owner
Home Financials are based on the most recent Mortgage that was taken out on this home.
Original Mortgage
$194,750
Outstanding Balance
$148,020
Interest Rate
4.18%
Mortgage Type
New Conventional
Estimated Equity
$175,492
Purchase Details
Closed on
May 25, 2007
Sold by
Berlund Vicki A and Berlund Wilmur Vicki
Bought by
Berglund Vicki A
Home Financials for this Owner
Home Financials are based on the most recent Mortgage that was taken out on this home.
Original Mortgage
$148,800
Interest Rate
6.21%
Mortgage Type
New Conventional
Purchase Details
Closed on
Jul 26, 2006
Sold by
Lundblad Steve
Bought by
Berglund Victoria A
Create a Home Valuation Report for This Property
The Home Valuation Report is an in-depth analysis detailing your home's value as well as a comparison with similar homes in the area
Home Values in the Area
Average Home Value in this Area
Purchase History
| Date | Buyer | Sale Price | Title Company |
|---|---|---|---|
| Moss Chelsey R | $205,000 | Fm Title | |
| Berglund Vicki A | -- | -- | |
| Berglund Victoria A | -- | -- |
Source: Public Records
Mortgage History
| Date | Status | Borrower | Loan Amount |
|---|---|---|---|
| Open | Moss Chelsey R | $194,750 | |
| Previous Owner | Berglund Vicki A | $148,800 |
Source: Public Records
Tax History Compared to Growth
Tax History
| Year | Tax Paid | Tax Assessment Tax Assessment Total Assessment is a certain percentage of the fair market value that is determined by local assessors to be the total taxable value of land and additions on the property. | Land | Improvement |
|---|---|---|---|---|
| 2024 | $3,606 | $147,400 | $23,950 | $123,450 |
| 2023 | $4,182 | $149,650 | $23,950 | $125,700 |
| 2022 | $4,017 | $137,100 | $23,950 | $113,150 |
| 2021 | $3,845 | $122,900 | $17,400 | $105,500 |
| 2020 | $3,739 | $122,650 | $17,400 | $105,250 |
| 2019 | $3,537 | $120,050 | $17,400 | $102,650 |
| 2018 | $3,365 | $119,000 | $17,400 | $101,600 |
| 2017 | $3,178 | $115,100 | $17,400 | $97,700 |
| 2016 | $2,817 | $111,200 | $17,400 | $93,800 |
| 2015 | $2,321 | $82,450 | $14,450 | $68,000 |
| 2014 | $2,279 | $77,050 | $14,450 | $62,600 |
| 2013 | $2,319 | $77,050 | $14,450 | $62,600 |
Source: Public Records
Map
Nearby Homes
- 232 15th Ave W
- 226 10 1/2 Ave W
- 1447 Elmwood Ct
- 723 16th Ave W
- 1633 3rd St W
- 744 Elm St
- 830 12th Ave W
- 243 12 1 2 Ave E
- 514 7th Ave W
- 245 12th Ave E
- 336 13th Ave E
- 1844 1st St
- 237 10th Ave E
- 520 6th Ave W Unit 8
- 109 7th Ave E
- 1264 Marlys Dr W
- 431 Morrison St
- 719 5th Ave W
- 109 5th Ave W
- 437 10th Ave E