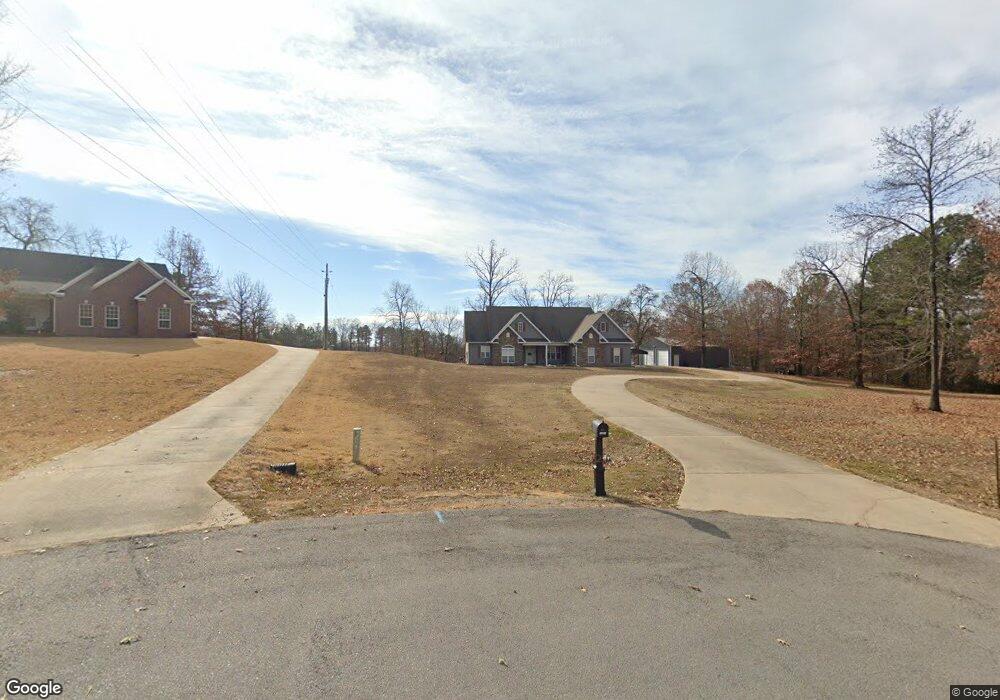
1301 Vanderbuilt Dr Benton, AR 72019
Estimated Value: $419,583 - $568,000
Studio
3
Baths
2,499
Sq Ft
$195/Sq Ft
Est. Value
About This Home
This home is located at 1301 Vanderbuilt Dr, Benton, AR 72019 and is currently estimated at $486,896, approximately $194 per square foot. 1301 Vanderbuilt Dr is a home located in Saline County with nearby schools including Benton Middle School, Caldwell Elementary School, and Benton Junior High School.
Ownership History
Date
Name
Owned For
Owner Type
Purchase Details
Closed on
Feb 2, 2021
Sold by
Bennett Chris and Bennett Amanda
Bought by
Allen Alex and Rowlett Allen Andrea
Current Estimated Value
Home Financials for this Owner
Home Financials are based on the most recent Mortgage that was taken out on this home.
Original Mortgage
$324,022
Outstanding Balance
$289,299
Interest Rate
2.6%
Mortgage Type
FHA
Estimated Equity
$197,597
Purchase Details
Closed on
Aug 3, 2009
Sold by
Morrow Dennis and Morrow Sarah
Bought by
Bennett Chris and Bennett Amanda
Home Financials for this Owner
Home Financials are based on the most recent Mortgage that was taken out on this home.
Original Mortgage
$9,000
Interest Rate
5.31%
Mortgage Type
Future Advance Clause Open End Mortgage
Purchase Details
Closed on
Dec 11, 2006
Sold by
Abbey Harold F and Abbey Janette A
Bought by
Morrow Dennis and Morrow Sarah
Purchase Details
Closed on
Aug 17, 2005
Sold by
Morrow Dennis R and Morrow Sarah N
Bought by
Abbey Harold F and Abbey Janette A
Create a Home Valuation Report for This Property
The Home Valuation Report is an in-depth analysis detailing your home's value as well as a comparison with similar homes in the area
Purchase History
| Date | Buyer | Sale Price | Title Company |
|---|---|---|---|
| Allen Alex | $330,000 | First National Title Company | |
| Bennett Chris | $39,000 | -- | |
| Morrow Dennis | $37,000 | -- | |
| Abbey Harold F | $36,000 | -- |
Source: Public Records
Mortgage History
| Date | Status | Borrower | Loan Amount |
|---|---|---|---|
| Open | Allen Alex | $324,022 | |
| Previous Owner | Bennett Chris | $9,000 |
Source: Public Records
Tax History
| Year | Tax Paid | Tax Assessment Tax Assessment Total Assessment is a certain percentage of the fair market value that is determined by local assessors to be the total taxable value of land and additions on the property. | Land | Improvement |
|---|---|---|---|---|
| 2025 | $3,640 | $70,548 | $10,080 | $60,468 |
| 2024 | $3,640 | $70,548 | $10,080 | $60,468 |
| 2023 | $3,315 | $64,070 | $10,080 | $53,990 |
| 2022 | $3,031 | $64,070 | $10,080 | $53,990 |
| 2021 | $2,199 | $47,950 | $7,200 | $40,750 |
| 2020 | $2,149 | $47,950 | $7,200 | $40,750 |
| 2019 | $2,149 | $47,950 | $7,200 | $40,750 |
| 2018 | $2,174 | $47,950 | $7,200 | $40,750 |
| 2017 | $2,174 | $47,950 | $7,200 | $40,750 |
| 2016 | $2,363 | $45,800 | $7,200 | $38,600 |
| 2015 | -- | $45,800 | $7,200 | $38,600 |
| 2014 | $2,063 | $45,800 | $7,200 | $38,600 |
Source: Public Records
Map
Nearby Homes
- 31 Ac. River Ridge Rd
- 1528 Brookshire Dr
- 522 Valley Hill Rd
- 20 Quail Run Dr
- 12 Quail Run Dr
- 31 Ac River Ridge Rd
- 1270 Fern Creek Dr
- Lot 3 Abrielle Ln
- 400 Kale Cove
- 301 Abrielle Ln
- 401 Kale Cove
- 6113 Fait Rd
- 8616 Old Congo Rd
- 907 Zeke Rd
- 208 Clearview
- 1265 Essex Dr
- 1129 Essex Dr
- 2025 Seven Gables
- 2480 Holly Ridge Cove
- 987 Joyce Dr
- 1300 Vanderbuilt Dr
- 0 Vanderbuilt Dr Unit 16003570
- 0 Vanderbuilt Dr Unit 20036646
- 0 Vanderbuilt Dr Unit 20035410
- 0 Vanderbuilt Dr Unit 20034867
- 0 Vanderbuilt Dr Unit 16036106
- 0 Vanderbuilt Dr Unit 17005703
- 7250 Troup Rd
- 1302 River Ridge Rd
- 1309 Vanderbuilt Dr
- 7224 Troup Rd
- 7206 Troup Rd
- 1308 Vanderbuilt Dr
- 1244 River Ridge Rd
- 7324 Troup Rd
- 843 Salem Heights Dr
- 7332 Troup Rd
- 1317 Vanderbuilt Dr
- 1314 Vanderbuilt Dr
- 839 Salem Heights Dr
Your Personal Tour Guide
Ask me questions while you tour the home.