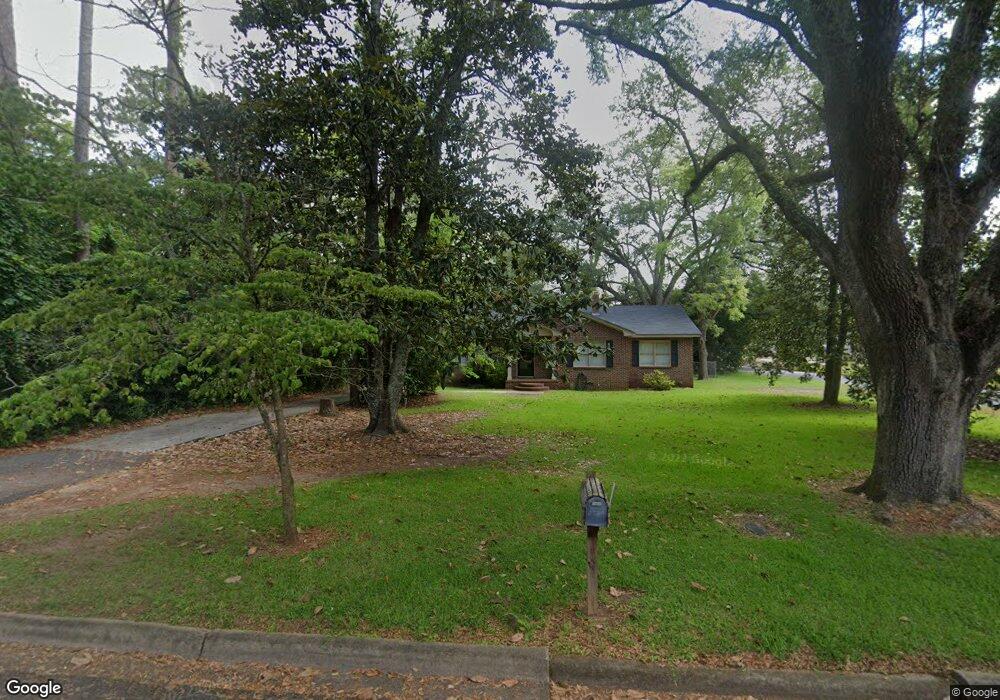
1301 W 4th Ave Albany, GA 31707
Palmyra Heights NeighborhoodEstimated Value: $119,010 - $158,000
3
Beds
2
Baths
1,614
Sq Ft
$86/Sq Ft
Est. Value
About This Home
This home is located at 1301 W 4th Ave, Albany, GA 31707 and is currently estimated at $139,253, approximately $86 per square foot. 1301 W 4th Ave is a home located in Dougherty County with nearby schools including Sherwood Acres Elementary School, Merry Acres Middle School, and Albany High School.
Ownership History
Date
Name
Owned For
Owner Type
Purchase Details
Closed on
Nov 15, 2011
Sold by
Car Charles Thomas Mckinney Supplemental
Bought by
Sapp David S and Sapp Beverly M
Current Estimated Value
Home Financials for this Owner
Home Financials are based on the most recent Mortgage that was taken out on this home.
Original Mortgage
$74,575
Outstanding Balance
$7,207
Interest Rate
3.29%
Mortgage Type
New Conventional
Estimated Equity
$132,046
Purchase Details
Closed on
Mar 28, 2008
Sold by
Charles Thomas Mckinney
Bought by
Lear Sean P O
Purchase Details
Closed on
May 22, 1997
Sold by
Middleton John V
Bought by
O'Lear Sean P
Purchase Details
Closed on
May 21, 1997
Sold by
Middleton John V Sr By Exec & Trustee
Bought by
O'Lear Sean P
Purchase Details
Closed on
Jan 12, 1993
Sold by
Middleton Thelma
Bought by
Middleton John V
Purchase Details
Closed on
Jan 1, 1963
Bought by
Middleton Thelma
Create a Home Valuation Report for This Property
The Home Valuation Report is an in-depth analysis detailing your home's value as well as a comparison with similar homes in the area
Home Values in the Area
Average Home Value in this Area
Purchase History
| Date | Buyer | Sale Price | Title Company |
|---|---|---|---|
| Sapp David S | $78,500 | -- | |
| Lear Sean P O | $75,000 | -- | |
| O'Lear Sean P | $27,000 | -- | |
| O'Lear Sean P | $27,000 | -- | |
| Middleton John V | -- | -- | |
| Middleton Thelma | -- | -- |
Source: Public Records
Mortgage History
| Date | Status | Borrower | Loan Amount |
|---|---|---|---|
| Open | Sapp David S | $74,575 |
Source: Public Records
Tax History Compared to Growth
Tax History
| Year | Tax Paid | Tax Assessment Tax Assessment Total Assessment is a certain percentage of the fair market value that is determined by local assessors to be the total taxable value of land and additions on the property. | Land | Improvement |
|---|---|---|---|---|
| 2024 | $1,418 | $29,720 | $7,240 | $22,480 |
| 2023 | $1,385 | $29,720 | $7,240 | $22,480 |
| 2022 | $1,390 | $29,720 | $7,240 | $22,480 |
| 2021 | $1,288 | $29,720 | $7,240 | $22,480 |
| 2020 | $1,292 | $29,720 | $7,240 | $22,480 |
| 2019 | $1,296 | $29,720 | $7,240 | $22,480 |
| 2018 | $1,302 | $29,720 | $7,240 | $22,480 |
| 2017 | $1,213 | $29,720 | $7,240 | $22,480 |
| 2016 | $1,213 | $29,720 | $7,240 | $22,480 |
| 2015 | $1,217 | $29,720 | $7,240 | $22,480 |
| 2014 | $1,184 | $29,280 | $6,800 | $22,480 |
Source: Public Records
Map
Nearby Homes