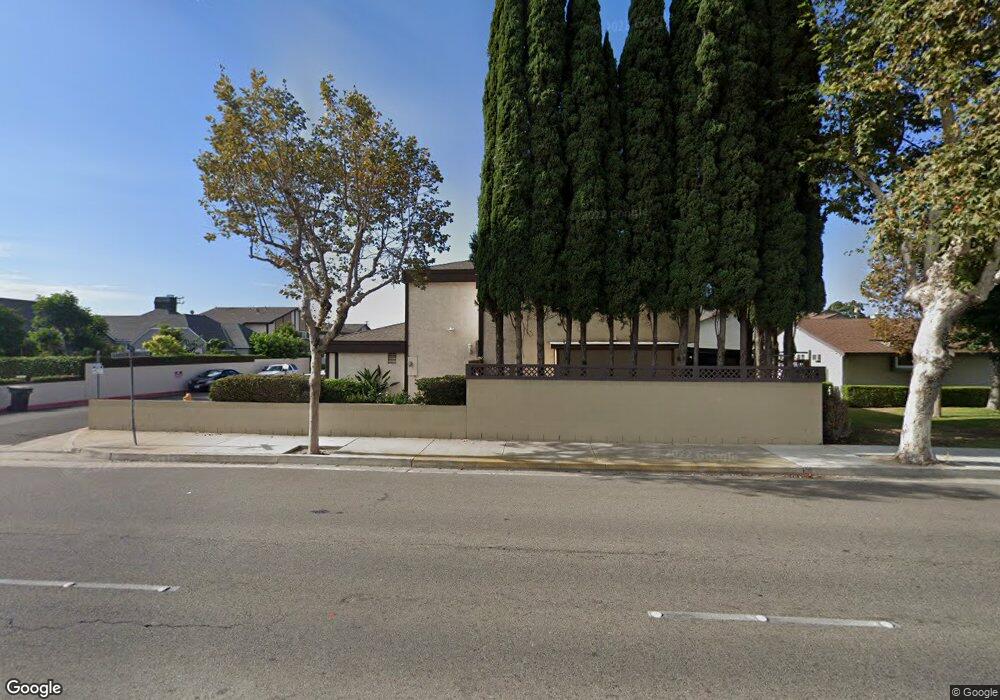
13011 Balfour Cir Garden Grove, CA 92843
Estimated Value: $467,000 - $1,064,000
4
Beds
3
Baths
1,432
Sq Ft
$588/Sq Ft
Est. Value
About This Home
This home is located at 13011 Balfour Cir, Garden Grove, CA 92843 and is currently estimated at $841,576, approximately $587 per square foot. 13011 Balfour Cir is a home located in Orange County with nearby schools including Riverdale Elementary School, Doig Intermediate School, and Santiago High School.
Ownership History
Date
Name
Owned For
Owner Type
Purchase Details
Closed on
Jan 18, 2024
Sold by
Vu Mark and Vu Amy
Bought by
Vu Mark and Vu Amy
Current Estimated Value
Purchase Details
Closed on
Aug 13, 2022
Sold by
Vu Luc Trong & Loan
Bought by
Vu Mark and Vu Amy
Purchase Details
Closed on
May 3, 1995
Sold by
Steele Denise C
Bought by
Vu Luc Trong
Home Financials for this Owner
Home Financials are based on the most recent Mortgage that was taken out on this home.
Original Mortgage
$87,600
Interest Rate
8.32%
Purchase Details
Closed on
Feb 11, 1994
Sold by
Steele Denise C
Bought by
Steele Denise C
Home Financials for this Owner
Home Financials are based on the most recent Mortgage that was taken out on this home.
Original Mortgage
$72,600
Interest Rate
6.12%
Create a Home Valuation Report for This Property
The Home Valuation Report is an in-depth analysis detailing your home's value as well as a comparison with similar homes in the area
Home Values in the Area
Average Home Value in this Area
Purchase History
| Date | Buyer | Sale Price | Title Company |
|---|---|---|---|
| Vu Mark | -- | Accommodation/Courtesy Recordi | |
| Vu Mark | -- | Accommodation/Courtesy Recordi | |
| Vu Mark | $300,000 | -- | |
| Vu Luc Trong | $109,500 | California Counties Title Co | |
| Steele Denise C | -- | United Title Company |
Source: Public Records
Mortgage History
| Date | Status | Borrower | Loan Amount |
|---|---|---|---|
| Previous Owner | Vu Luc Trong | $87,600 | |
| Previous Owner | Steele Denise C | $72,600 |
Source: Public Records
Tax History Compared to Growth
Tax History
| Year | Tax Paid | Tax Assessment Tax Assessment Total Assessment is a certain percentage of the fair market value that is determined by local assessors to be the total taxable value of land and additions on the property. | Land | Improvement |
|---|---|---|---|---|
| 2025 | $7,118 | $572,220 | $452,290 | $119,930 |
| 2024 | $7,118 | $561,000 | $443,421 | $117,579 |
| 2023 | $6,989 | $550,000 | $434,726 | $115,274 |
| 2022 | $2,384 | $173,306 | $35,963 | $137,343 |
| 2021 | $2,350 | $169,908 | $35,258 | $134,650 |
| 2020 | $2,321 | $168,166 | $34,896 | $133,270 |
| 2019 | $2,292 | $164,869 | $34,212 | $130,657 |
| 2018 | $2,237 | $161,637 | $33,541 | $128,096 |
| 2017 | $2,212 | $158,468 | $32,883 | $125,585 |
| 2016 | $2,110 | $155,361 | $32,238 | $123,123 |
| 2015 | $2,081 | $153,028 | $31,754 | $121,274 |
| 2014 | $2,032 | $150,031 | $31,132 | $118,899 |
Source: Public Records
Map
Nearby Homes
- 4002 W El Rancho Ave
- 13131 Siemon Ave
- 2302 Lori Ln
- 13052 Laramore Ln
- 2321 Downie Place
- 1704 Mcevoy Ln
- 13141 Windsor Ln
- 2214 Arden St
- 12560 Haster St Unit 205
- 12560 Haster St Unit 204
- 2525 N Pacific Ave
- 13431 Lilly St
- 13102 Partridge St Unit 7
- 13102 Partridge St Unit 54
- 12681 Trask Ave
- 2137 Tamy Ln
- 12812 Timber Rd Unit 22
- 12848 Timber Rd Unit 33
- 2602 N Louise St
- 1222 W Sharon Rd
- 13017 Balfour Cir
- 13023 Balfour Cir
- 13029 Balfour Cir
- 13466 Garden Grove Blvd
- 13033 Balfour Cir
- 13462 Garden Grove Blvd
- 13454 Peony Ave
- 13037 Balfour Cir
- 13032 Balfour Cir
- 13462 Peony Ave
- 13468 Peony Ave
- 13036 Balfour Cir
- 12962 Dahlia St
- 13448 Peony Ave
- 13043 Balfour Cir
- 12954 Dahlia St
- 13440 Peony Ave
- 13392 Garden Grove Blvd
- 13042 Balfour Cir
- 13011 Lewis St