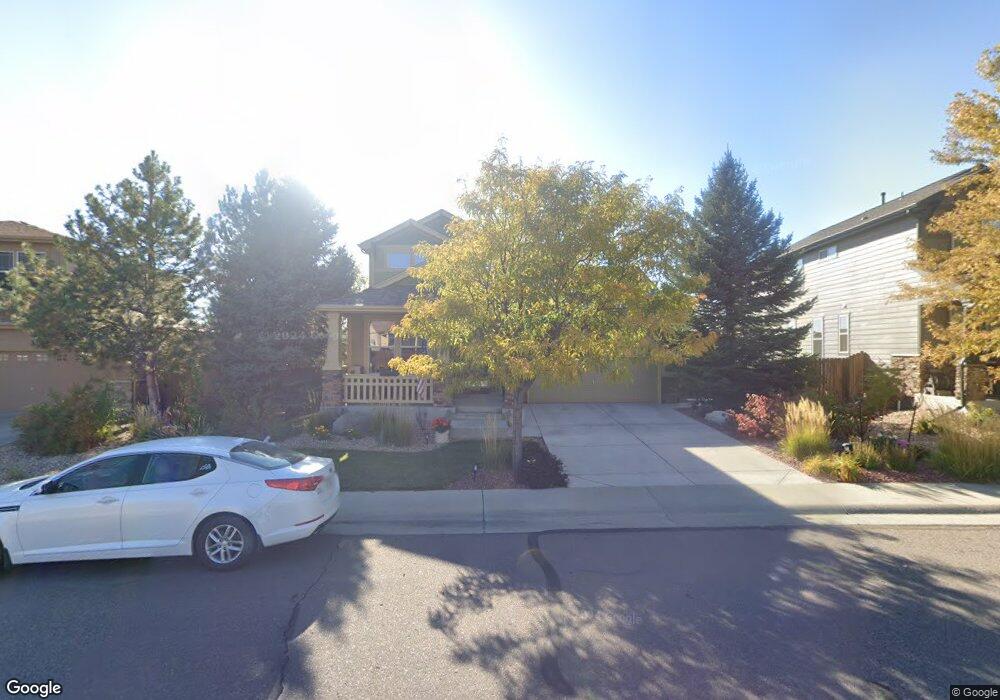
13011 Trenton Place Thornton, CO 80602
The Villages at Riverdale NeighborhoodEstimated Value: $591,000 - $635,000
3
Beds
3
Baths
3,459
Sq Ft
$176/Sq Ft
Est. Value
About This Home
This home is located at 13011 Trenton Place, Thornton, CO 80602 and is currently estimated at $610,052, approximately $176 per square foot. 13011 Trenton Place is a home located in Adams County with nearby schools including Brantner Elementary School, Elderberry Elementary, and Ray Wiltsey Middle School.
Ownership History
Date
Name
Owned For
Owner Type
Purchase Details
Closed on
Feb 14, 2014
Sold by
Johston Brett and Johnston Andrea L
Bought by
Leatherby Rick and Leatherby Joann
Current Estimated Value
Home Financials for this Owner
Home Financials are based on the most recent Mortgage that was taken out on this home.
Original Mortgage
$316,756
Outstanding Balance
$224,031
Interest Rate
2.75%
Mortgage Type
VA
Estimated Equity
$386,021
Purchase Details
Closed on
Jul 22, 2010
Sold by
Taylor Morrison Of Colorado Inc
Bought by
Johnston Brett and Johnston Andrea L
Home Financials for this Owner
Home Financials are based on the most recent Mortgage that was taken out on this home.
Original Mortgage
$315,748
Interest Rate
4.37%
Mortgage Type
FHA
Create a Home Valuation Report for This Property
The Home Valuation Report is an in-depth analysis detailing your home's value as well as a comparison with similar homes in the area
Home Values in the Area
Average Home Value in this Area
Purchase History
| Date | Buyer | Sale Price | Title Company |
|---|---|---|---|
| Leatherby Rick | $328,500 | Fidelity National Title Insu | |
| Johnston Brett | $320,000 | First American Title Ins Co |
Source: Public Records
Mortgage History
| Date | Status | Borrower | Loan Amount |
|---|---|---|---|
| Open | Leatherby Rick | $316,756 | |
| Previous Owner | Johnston Brett | $315,748 |
Source: Public Records
Tax History Compared to Growth
Tax History
| Year | Tax Paid | Tax Assessment Tax Assessment Total Assessment is a certain percentage of the fair market value that is determined by local assessors to be the total taxable value of land and additions on the property. | Land | Improvement |
|---|---|---|---|---|
| 2024 | $3,536 | $34,880 | $7,190 | $27,690 |
| 2023 | $3,519 | $39,980 | $7,100 | $32,880 |
| 2022 | $2,993 | $30,520 | $7,300 | $23,220 |
| 2021 | $2,884 | $30,520 | $7,300 | $23,220 |
| 2020 | $2,706 | $29,890 | $7,510 | $22,380 |
| 2019 | $2,708 | $29,890 | $7,510 | $22,380 |
| 2018 | $2,476 | $27,310 | $6,480 | $20,830 |
| 2017 | $2,472 | $27,310 | $6,480 | $20,830 |
| 2016 | $2,006 | $22,080 | $4,780 | $17,300 |
| 2015 | $2,002 | $22,080 | $4,780 | $17,300 |
| 2014 | -- | $20,250 | $3,980 | $16,270 |
Source: Public Records
Map
Nearby Homes
- 7593 E 130th Cir
- 12951 Syracuse St
- 8222 E 129th Place
- 7782 E 131st Place
- 8051 E 128th Place
- 12729 Ulster St
- 12673 Tamarac St
- 12649 Tamarac St
- 8489 E 130th Ave
- 8386 E 132nd Dr
- 13420 Spruce St
- 13407 Valentia St
- 13417 Valentia St
- 7127 E 126th Place
- 13436 Valentia St
- 7097 E 126th Place
- 7047 E 126th Place
- 7096 E 126th Place
- 7037 E 126th Place
- 13409 Wabash St
- 13021 Trenton Place
- 13001 Trenton Place
- 13031 Trenton Place
- 12991 Trenton Place
- 13012 Trenton Place
- 13022 Trenton Place
- 13005 Tamarac Place
- 13032 Trenton Place
- 13043 Trenton Place
- 13025 Tamarac Place
- 13042 Trenton Place
- 13035 Tamarac Place
- 13052 Spruce Place
- 13053 Trenton Place
- 13055 Tamarac Place
- 13052 Trenton Place
- 7901 E 130th Ave
- 13012 Tamarac Place
- 13103 Spruce Place
- 13022 Tamarac Place