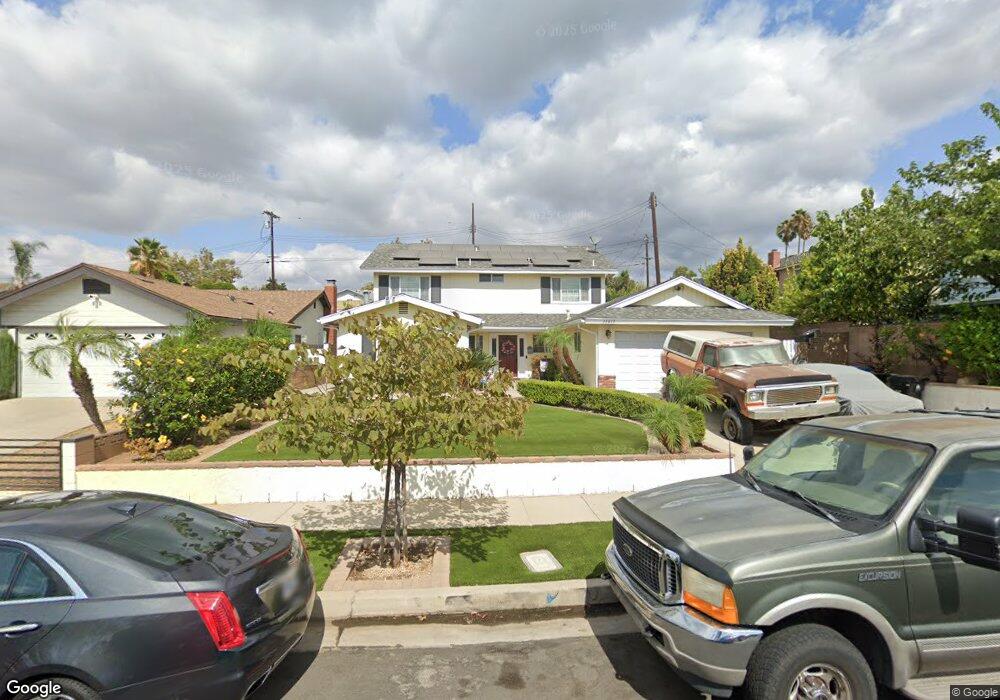
13013 Hagar St Sylmar, CA 91342
Estimated Value: $889,000 - $1,100,000
5
Beds
3
Baths
2,310
Sq Ft
$422/Sq Ft
Est. Value
About This Home
This home is located at 13013 Hagar St, Sylmar, CA 91342 and is currently estimated at $973,879, approximately $421 per square foot. 13013 Hagar St is a home located in Los Angeles County with nearby schools including Harding Street Elementary School, San Fernando Middle School, and San Fernando Senior High School.
Ownership History
Date
Name
Owned For
Owner Type
Purchase Details
Closed on
Jul 9, 2014
Sold by
Terrazas Mario F
Bought by
Terrazas Mario F and Deleon Terrazas Olivia
Current Estimated Value
Home Financials for this Owner
Home Financials are based on the most recent Mortgage that was taken out on this home.
Original Mortgage
$380,000
Outstanding Balance
$288,794
Interest Rate
4.1%
Mortgage Type
New Conventional
Estimated Equity
$685,085
Purchase Details
Closed on
Mar 21, 2011
Sold by
Hammonds Jesse Dean
Bought by
Terrazas Mario F and Deleon Olivia
Home Financials for this Owner
Home Financials are based on the most recent Mortgage that was taken out on this home.
Original Mortgage
$346,000
Interest Rate
4.75%
Mortgage Type
FHA
Purchase Details
Closed on
Aug 14, 1996
Sold by
Kennedy David E and Kennedy Patricia
Bought by
Hammonds Jesse Dean
Home Financials for this Owner
Home Financials are based on the most recent Mortgage that was taken out on this home.
Original Mortgage
$104,240
Interest Rate
8.18%
Create a Home Valuation Report for This Property
The Home Valuation Report is an in-depth analysis detailing your home's value as well as a comparison with similar homes in the area
Home Values in the Area
Average Home Value in this Area
Purchase History
| Date | Buyer | Sale Price | Title Company |
|---|---|---|---|
| Terrazas Mario F | -- | Lawyers Title Company | |
| Terrazas Mario F | $355,000 | Chicago Title Company | |
| Hammonds Jesse Dean | -- | Old Republic Title Company |
Source: Public Records
Mortgage History
| Date | Status | Borrower | Loan Amount |
|---|---|---|---|
| Open | Terrazas Mario F | $380,000 | |
| Closed | Terrazas Mario F | $346,000 | |
| Previous Owner | Hammonds Jesse Dean | $104,240 |
Source: Public Records
Tax History Compared to Growth
Tax History
| Year | Tax Paid | Tax Assessment Tax Assessment Total Assessment is a certain percentage of the fair market value that is determined by local assessors to be the total taxable value of land and additions on the property. | Land | Improvement |
|---|---|---|---|---|
| 2025 | $5,760 | $454,804 | $170,648 | $284,156 |
| 2024 | $5,760 | $445,887 | $167,302 | $278,585 |
| 2023 | $5,654 | $437,145 | $164,022 | $273,123 |
| 2022 | $5,399 | $428,574 | $160,806 | $267,768 |
| 2021 | $5,324 | $420,171 | $157,653 | $262,518 |
| 2019 | $5,170 | $407,711 | $152,978 | $254,733 |
| 2018 | $5,075 | $399,718 | $149,979 | $249,739 |
| 2016 | $4,835 | $384,199 | $144,156 | $240,043 |
| 2015 | $4,767 | $378,429 | $141,991 | $236,438 |
| 2014 | $4,789 | $371,017 | $139,210 | $231,807 |
Source: Public Records
Map
Nearby Homes
- 13219 Shaw Ln
- 12940 Harding St
- 12745 N Watt Ln Unit B
- 12745 N Watt Ln Unit B
- 13384 Foothill Blvd
- 12547 Cometa Ave
- 13197 Leach St
- 13912 N Mesa Alta Rd
- 13247 Tripoli Ave
- 12888 Four Palms Ln
- 12826 Bromont Ave
- 13550 Foothill Blvd Unit 27
- 13372 Hyland Ct
- 13540 Hubbard St Unit 21
- 1965 8th St
- 13475 Hubbard St Unit 31
- 13103 Angeles Trail Way Unit 301
- 13750 Hubbard St Unit 77
- 901 N Maclay Ave
- 12835 W Hemingway Dr
- 12831 Wheeler Ave
- 12835 Wheeler Ave
- 13044 Alexander St
- 13036 Alexander St
- 13050 Alexander St
- 13032 Alexander St
- 13033 Hagar St
- 13010 Hagar St
- 13018 Hagar St
- 13022 Hagar St
- 13056 Alexander St
- 12830 Wheeler Ave
- 13028 Hagar St
- 12836 Wheeler Ave
- 13039 Hagar St
- 12842 Wheeler Ave
- 13064 Alexander St
- 13036 Hagar St
- 12971 Hagar St
- 13037 Alexander St