
Seller's Agent in 2025
Laura Hough
BHHS PenFed (actual)
(540) 220-4466
2 in this area
29 Total Sales
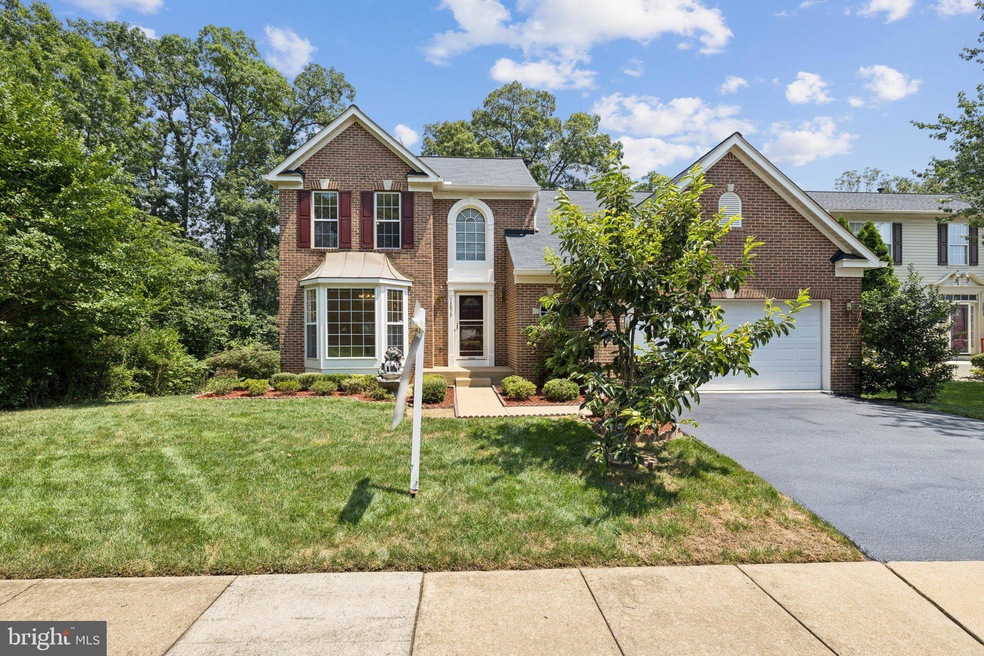
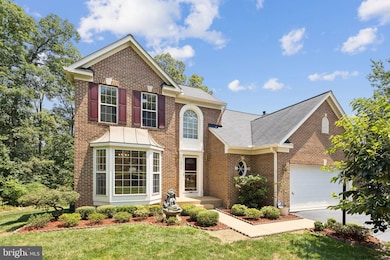
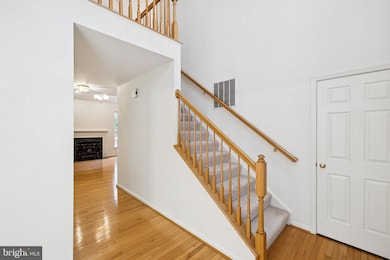
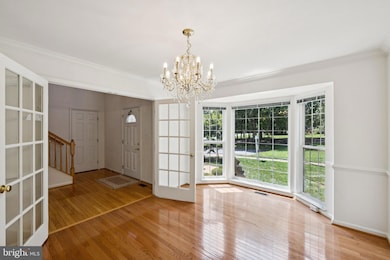
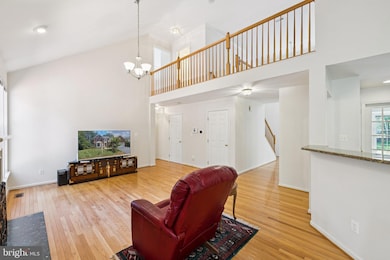
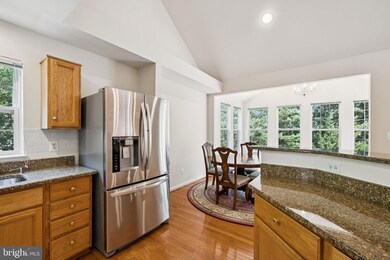
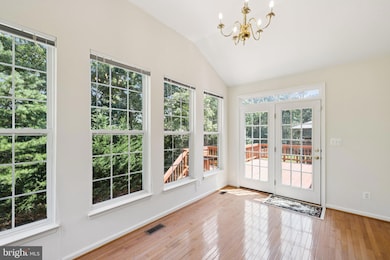
REDUCED Motivated Seller - Rare MAIN LEVEL PRIMARY!! One of the largest models built in Park Center offering over 4,200 sq. ft. This brick front beauty offers main level bedroom, private bath with soaking tub and walk in closet. Family room has vaulted ceilings with a gas fireplace. Kitchen with granite counters, stainless appliances, oversized fridge. Bright sunroom or breakfast area overlooks trees and opens to expansive deck with stairs. Main level is mostly hardwood flooring. Two oversized bedrooms and full bath on upper level. Fully finished basement with recreation room, storage, fourth bedroom and full bath. Roof 2017 with leaf guards, 75-gallon water heater 2018, LG refrigerator 2020. Verizon Fios available. Washer, Dryer & Garage fridge convey AS-IS. Within the Park Center community you can enjoy the tot lots, tennis court and relaxing pool. Enjoy shopping, restaurants, and more with the convenience of proximity to Occoquan Historic District, Potomac Mills, Stonebridge town center, Neabsco Regional Park and much more. Lupine Turn is located conveniently off Old Bridge Rd with easy access to I-95. With the VRE station, I-95 Express Lanes and commuter lots within 3 miles, commuting is super convenient to Washington, DC, Fort Belvoir, Quantico and more.
Last Agent to Sell the Property
(540) 220-4466 soldwithlaura@aol.com Berkshire Hathaway HomeServices PenFed Realty Listed on: 08/05/2025
Last Buyer's Agent
(703) 930-8686 kevin@carteradvantage.com RE/MAX Distinctive Real Estate, Inc. License #0225059627
| Date | Type | Sale Price | Title Company |
|---|---|---|---|
| Deed | $730,000 | Westcor Land Title | |
| Deed | $385,000 | Stewart Title Guaranty Co | |
| Deed | -- | -- | |
| Deed | $262,050 | -- |
| Date | Status | Loan Amount | Loan Type |
|---|---|---|---|
| Open | $693,500 | New Conventional | |
| Previous Owner | $380,000 | VA | |
| Previous Owner | $272,000 | No Value Available | |
| Previous Owner | $248,000 | New Conventional |
| Date | Event | Price | List to Sale | Price per Sq Ft |
|---|---|---|---|---|
| 10/14/2025 10/14/25 | Sold | $730,000 | -3.9% | $172 / Sq Ft |
| 09/16/2025 09/16/25 | Price Changed | $760,000 | -1.9% | $179 / Sq Ft |
| 08/16/2025 08/16/25 | Price Changed | $775,000 | -3.1% | $182 / Sq Ft |
| 08/05/2025 08/05/25 | For Sale | $799,900 | -- | $188 / Sq Ft |
| Year | Tax Paid | Tax Assessment Tax Assessment Total Assessment is a certain percentage of the fair market value that is determined by local assessors to be the total taxable value of land and additions on the property. | Land | Improvement |
|---|---|---|---|---|
| 2025 | $6,983 | $750,400 | $206,100 | $544,300 |
| 2024 | $6,983 | $702,200 | $192,400 | $509,800 |
| 2023 | $6,911 | $664,200 | $182,000 | $482,200 |
| 2022 | $6,982 | $630,400 | $182,000 | $448,400 |
| 2021 | $7,050 | $579,600 | $158,700 | $420,900 |
| 2020 | $8,669 | $559,300 | $153,800 | $405,500 |
| 2019 | $7,660 | $494,200 | $138,700 | $355,500 |
| 2018 | $5,937 | $491,700 | $138,700 | $353,000 |
| 2017 | $6,073 | $494,200 | $138,900 | $355,300 |
| 2016 | $6,080 | $499,600 | $139,600 | $360,000 |
| 2015 | $5,604 | $474,100 | $132,200 | $341,900 |
| 2014 | $5,604 | $450,000 | $124,400 | $325,600 |
Seller's Agent in 2025
Laura Hough
BHHS PenFed (actual)
(540) 220-4466
2 in this area
29 Total Sales
Buyer's Agent in 2025
Kevin Carter
RE/MAX
(703) 930-8686
1 in this area
156 Total Sales
Source: Bright MLS
MLS Number: VAPW2100012
APN: 8392-39-3578
Disclaimer: Certain information contained herein is derived from information provided by parties other than Homes.com. All information provided is deemed reliable, but is not guaranteed to be accurate and should be independently verified.
![]() The data relating to real estate for sale on this website appears in part through the BRIGHT Internet Data Exchange program, a voluntary cooperative exchange of property listing data between licensed real estate brokerage firms, and is provided by BRIGHT through a licensing agreement.
The data relating to real estate for sale on this website appears in part through the BRIGHT Internet Data Exchange program, a voluntary cooperative exchange of property listing data between licensed real estate brokerage firms, and is provided by BRIGHT through a licensing agreement.
Listing information is from various brokers who participate in the Bright MLS IDX program and not all listings may be visible on the site.
The property information being provided on or through the website is for the personal, non-commercial use of consumers and such information may not be used for any purpose other than to identify prospective properties consumers may be interested in purchasing.
Some properties which appear for sale on the website may no longer be available because they are for instance, under contract, sold or are no longer being offered for sale.
Property information displayed is deemed reliable but is not guaranteed.
Copyright 2025 Bright MLS, Inc.