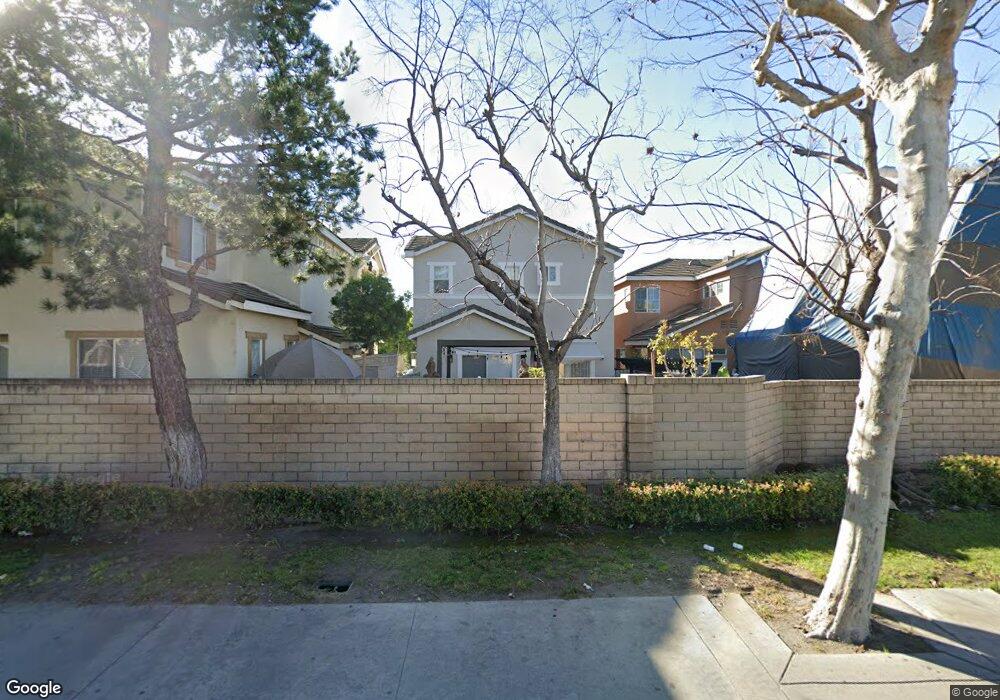
13013 Maple Dr Garden Grove, CA 92843
Estimated Value: $800,257 - $887,000
3
Beds
3
Baths
1,407
Sq Ft
$600/Sq Ft
Est. Value
About This Home
This home is located at 13013 Maple Dr, Garden Grove, CA 92843 and is currently estimated at $843,814, approximately $599 per square foot. 13013 Maple Dr is a home located in Orange County with nearby schools including Peters K-3 Elementary School, Izaak Walton Intermediate School, and Santiago High School.
Ownership History
Date
Name
Owned For
Owner Type
Purchase Details
Closed on
Oct 26, 2021
Sold by
Nguyen Huong
Bought by
Nguyen Huong and Huong Nguyen Living Trust
Current Estimated Value
Purchase Details
Closed on
Jul 3, 2001
Sold by
Vanlee Suzanne
Bought by
Nguyen Huong
Home Financials for this Owner
Home Financials are based on the most recent Mortgage that was taken out on this home.
Original Mortgage
$110,000
Interest Rate
7.19%
Purchase Details
Closed on
Apr 14, 1999
Sold by
Lee Michael H
Bought by
Vanlee Suzanne
Home Financials for this Owner
Home Financials are based on the most recent Mortgage that was taken out on this home.
Original Mortgage
$177,850
Interest Rate
8.5%
Purchase Details
Closed on
Feb 24, 1999
Sold by
Sycamore Walk Llc
Bought by
Vanlee Suzanne
Home Financials for this Owner
Home Financials are based on the most recent Mortgage that was taken out on this home.
Original Mortgage
$177,850
Interest Rate
8.5%
Create a Home Valuation Report for This Property
The Home Valuation Report is an in-depth analysis detailing your home's value as well as a comparison with similar homes in the area
Purchase History
| Date | Buyer | Sale Price | Title Company |
|---|---|---|---|
| Nguyen Huong | -- | None Available | |
| Nguyen Huong | $260,000 | Fidelity National Title | |
| Vanlee Suzanne | -- | First American Title Ins Co | |
| Vanlee Suzanne | $237,500 | First American Title Ins Co |
Source: Public Records
Mortgage History
| Date | Status | Borrower | Loan Amount |
|---|---|---|---|
| Closed | Nguyen Huong | $110,000 | |
| Previous Owner | Vanlee Suzanne | $177,850 | |
| Closed | Vanlee Suzanne | $59,250 |
Source: Public Records
Tax History
| Year | Tax Paid | Tax Assessment Tax Assessment Total Assessment is a certain percentage of the fair market value that is determined by local assessors to be the total taxable value of land and additions on the property. | Land | Improvement |
|---|---|---|---|---|
| 2025 | $4,827 | $384,090 | $165,692 | $218,398 |
| 2024 | $4,827 | $376,559 | $162,443 | $214,116 |
| 2023 | $4,736 | $369,176 | $159,258 | $209,918 |
| 2022 | $4,629 | $361,938 | $156,136 | $205,802 |
| 2021 | $4,563 | $354,842 | $153,075 | $201,767 |
| 2020 | $4,508 | $351,204 | $151,505 | $199,699 |
| 2019 | $4,446 | $344,318 | $148,534 | $195,784 |
| 2018 | $4,337 | $337,567 | $145,621 | $191,946 |
| 2017 | $4,291 | $330,949 | $142,766 | $188,183 |
| 2016 | $4,078 | $324,460 | $139,966 | $184,494 |
| 2015 | $4,023 | $319,587 | $137,864 | $181,723 |
| 2014 | $3,929 | $313,327 | $135,163 | $178,164 |
Source: Public Records
Map
Nearby Homes
- 12071 Acacia Ave
- 11712 Stuart Dr
- 12861 West St Unit 157
- 12861 West St Unit 100
- 11717 Garden Grove Blvd
- 11741 Rose Dr
- 11716 Rose Dr
- 12301 Granite Place
- 12592 Kathy Ln
- 12661 Strathmore Dr
- 12346 Flint Place
- 13391 Palm St
- 13096 Blackbird St Unit 164
- 12292 Ranchero Ave Unit 4
- 12152 Trask Ave Unit 57
- 11441 Stanford Ave
- 11662 Pickett Ln
- 13336 Sandra Place
- 13102 Partridge St Unit 51
- 13102 Partridge St
- 13011 Maple Dr
- 12071 Sycamore Ln
- 12065 Sycamore Ln
- 13009 Maple Dr
- 12077 Sycamore Ln
- 13008 Maple Dr
- 13018 Maple Dr
- 12059 Sycamore Ln
- 12078 Sycamore Ln
- 12053 Sycamore Ln
- 12047 Sycamore Ln
- 13010 Maple Dr
- 12084 Sycamore Ln
- 13016 Maple Dr
- 13020 Maple Dr
- 12072 Sycamore Ln
- 13012 Maple Dr
- 12048 Sycamore Ln
- 12035 Sycamore Ln
- 13022 Maple Dr
Your Personal Tour Guide
Ask me questions while you tour the home.