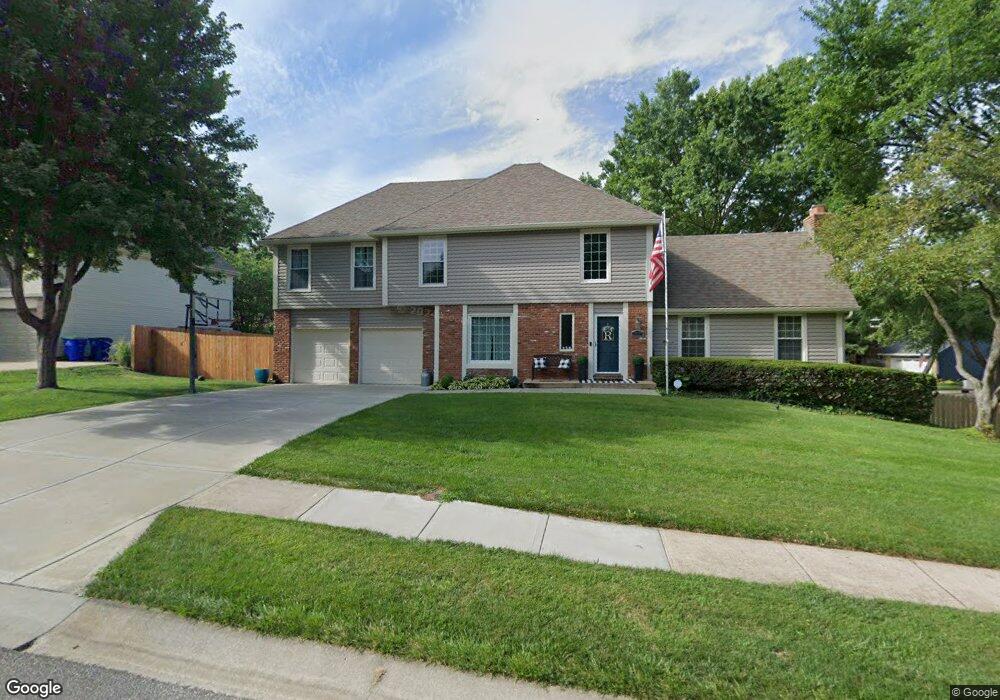
13017 W 70th Terrace Shawnee, KS 66216
Estimated Value: $417,000 - $447,055
4
Beds
3
Baths
2,059
Sq Ft
$210/Sq Ft
Est. Value
About This Home
This home is located at 13017 W 70th Terrace, Shawnee, KS 66216 and is currently estimated at $432,764, approximately $210 per square foot. 13017 W 70th Terrace is a home located in Johnson County with nearby schools including Rhein Benninghoven Elementary School, Trailridge Middle School, and Shawnee Mission Northwest High School.
Ownership History
Date
Name
Owned For
Owner Type
Purchase Details
Closed on
Feb 22, 2017
Sold by
Mcquinn Suzanne R
Bought by
Rollins Gregory James and Rollins Stephanie Ann
Current Estimated Value
Home Financials for this Owner
Home Financials are based on the most recent Mortgage that was taken out on this home.
Original Mortgage
$215,000
Outstanding Balance
$177,961
Interest Rate
4.19%
Mortgage Type
New Conventional
Estimated Equity
$254,803
Purchase Details
Closed on
Dec 30, 2016
Sold by
Mcquinn Kenneth Delmar
Bought by
Mcquinn Suzanne R
Home Financials for this Owner
Home Financials are based on the most recent Mortgage that was taken out on this home.
Original Mortgage
$215,000
Outstanding Balance
$177,961
Interest Rate
4.19%
Mortgage Type
New Conventional
Estimated Equity
$254,803
Create a Home Valuation Report for This Property
The Home Valuation Report is an in-depth analysis detailing your home's value as well as a comparison with similar homes in the area
Home Values in the Area
Average Home Value in this Area
Purchase History
| Date | Buyer | Sale Price | Title Company |
|---|---|---|---|
| Rollins Gregory James | -- | None Available | |
| Mcquinn Suzanne R | -- | None Available |
Source: Public Records
Mortgage History
| Date | Status | Borrower | Loan Amount |
|---|---|---|---|
| Open | Rollins Gregory James | $215,000 | |
| Previous Owner | Mcquinn Suzanne R | $215,000 |
Source: Public Records
Tax History Compared to Growth
Tax History
| Year | Tax Paid | Tax Assessment Tax Assessment Total Assessment is a certain percentage of the fair market value that is determined by local assessors to be the total taxable value of land and additions on the property. | Land | Improvement |
|---|---|---|---|---|
| 2024 | $4,071 | $38,502 | $9,399 | $29,103 |
| 2023 | $3,959 | $36,938 | $9,399 | $27,539 |
| 2022 | $3,587 | $33,350 | $8,170 | $25,180 |
| 2021 | $3,592 | $31,326 | $7,428 | $23,898 |
| 2020 | $3,408 | $29,326 | $6,751 | $22,575 |
| 2019 | $3,133 | $26,921 | $5,114 | $21,807 |
| 2018 | $3,062 | $26,208 | $5,114 | $21,094 |
| 2017 | $2,968 | $25,012 | $5,346 | $19,666 |
| 2016 | $3,381 | $28,163 | $5,346 | $22,817 |
| 2015 | $3,125 | $26,990 | $5,346 | $21,644 |
| 2013 | -- | $25,921 | $5,346 | $20,575 |
Source: Public Records
Map
Nearby Homes
- 7105 Richards Dr
- 7115 Richards Dr
- 13100 W 72nd St
- Augusta Plan at Kenneth Estates
- Newport Plan at Kenneth Estates
- Rosemount II Plan at Kenneth Estates
- The Avala Villa Plan at Kenneth Estates
- The Rosemount Villa Plan at Kenneth Estates
- Catalina II Plan at Kenneth Estates
- The Avala Plan at Kenneth Estates
- 12811 W 71st St
- 7130 Westgate St
- 12914 W 67th St
- 6640 Pflumm Rd
- 13415 W 66th Terrace
- 12403 W 72nd Terrace
- 12300 W 67th Terrace
- 6564 Charles St
- 6556 Charles St
- 6610 Halsey St
- 13013 W 70th Terrace
- 7011 Richards Dr
- 7006 Richards Dr Unit 626UW
- 7006 Richards Dr
- 7002 Richards Dr
- 13018 W 70th Terrace
- 13009 W 70th Terrace
- 13014 W 70th Terrace
- 7015 Richards Dr
- 13100 W 70th Terrace
- 13010 W 70th Terrace
- 7008 Gillette St
- 7014 Richards Dr
- 13104 W 70th Terrace
- 13006 W 70th Terrace
- 7012 Gillette St
- 13108 W 70th Terrace
- 12916 W 70th Terrace
- 6916 Gillette Ct
- 7016 Gillette St