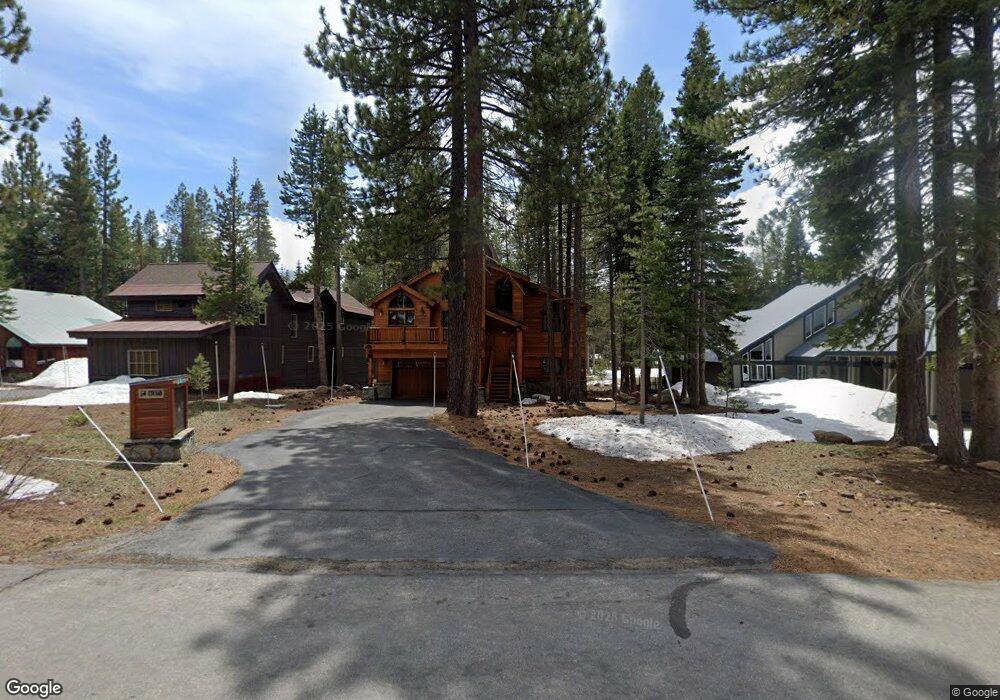
13018 Ski View Loop Truckee, CA 96161
Tahoe Donner NeighborhoodEstimated Value: $1,696,000 - $1,915,800
4
Beds
4
Baths
3,445
Sq Ft
$520/Sq Ft
Est. Value
About This Home
This home is located at 13018 Ski View Loop, Truckee, CA 96161 and is currently estimated at $1,789,950, approximately $519 per square foot. 13018 Ski View Loop is a home located in Nevada County with nearby schools including Truckee Elementary School, Alder Creek Middle School, and Tahoe Truckee High School.
Ownership History
Date
Name
Owned For
Owner Type
Purchase Details
Closed on
Sep 21, 2011
Sold by
Green Robert S and Kearly Green Kathleen
Bought by
Rouleau Bertrand D and Rouleau Mary C
Current Estimated Value
Purchase Details
Closed on
Jun 24, 2011
Sold by
Green Robert S and Kearley Green Kathleen
Bought by
Green Robert S and Kearley Green Kathleen
Purchase Details
Closed on
Jul 26, 2001
Sold by
Morrow Steven D and Morrow Mary R
Bought by
Green Robert S and Kearley Green Kathleen
Home Financials for this Owner
Home Financials are based on the most recent Mortgage that was taken out on this home.
Original Mortgage
$750,000
Interest Rate
7.25%
Mortgage Type
Purchase Money Mortgage
Purchase Details
Closed on
Mar 24, 1999
Sold by
Roberts Gary J and Roberts Patricia C
Bought by
Morrow Steven D and Morrow Mary R
Create a Home Valuation Report for This Property
The Home Valuation Report is an in-depth analysis detailing your home's value as well as a comparison with similar homes in the area
Home Values in the Area
Average Home Value in this Area
Purchase History
| Date | Buyer | Sale Price | Title Company |
|---|---|---|---|
| Rouleau Bertrand D | $950,000 | Placer Title Company | |
| Green Robert S | -- | Fidelity National Title Co | |
| Green Robert S | $950,000 | California Land Title Co | |
| Morrow Steven D | $88,000 | California Land Title Co |
Source: Public Records
Mortgage History
| Date | Status | Borrower | Loan Amount |
|---|---|---|---|
| Previous Owner | Green Robert S | $750,000 |
Source: Public Records
Tax History
| Year | Tax Paid | Tax Assessment Tax Assessment Total Assessment is a certain percentage of the fair market value that is determined by local assessors to be the total taxable value of land and additions on the property. | Land | Improvement |
|---|---|---|---|---|
| 2025 | $14,196 | $1,205,543 | $252,180 | $953,363 |
| 2024 | $14,109 | $1,181,906 | $247,236 | $934,670 |
| 2023 | $14,109 | $1,158,733 | $242,389 | $916,344 |
| 2022 | $13,781 | $1,136,014 | $237,637 | $898,377 |
| 2021 | $13,247 | $1,113,681 | $232,919 | $880,762 |
| 2020 | $13,172 | $1,102,262 | $230,531 | $871,731 |
| 2019 | $13,212 | $1,080,650 | $226,011 | $854,639 |
| 2018 | $12,438 | $1,059,462 | $221,580 | $837,882 |
| 2017 | $12,200 | $1,038,691 | $217,237 | $821,454 |
| 2016 | $12,113 | $1,017,555 | $212,207 | $805,348 |
| 2015 | $11,834 | $1,002,272 | $209,020 | $793,252 |
| 2014 | $11,347 | $982,640 | $204,926 | $777,714 |
Source: Public Records
Map
Nearby Homes
- 14258 Glacier View Dr
- 14579 Northwoods Blvd
- 13938 Northwoods Blvd
- 13854 Northwoods Blvd
- 14653 Northwoods Blvd
- 11926 Rhineland Ave
- 13420 Northwoods Blvd
- 13257 Ski Slope Way
- 13239 Northwoods Blvd Unit B
- 13038 Ski Slope Way
- 14487 Ski Slope Way
- 13205 Northwoods Blvd Unit 2
- 11711 Snowpeak Way Unit 555
- 11723 Snowpeak Way Unit 567
- 11566 Rhineland Ave
- 16725 Ski Slope Way Unit 5
- 11591 Snowpeak Way Unit 407
- 12574 Saint Moritz Ln
- 14096 Ramshorn St
- 12621 Peregrine Dr
- 13034 Ski View Loop
- 13004 Ski View Loop
- 12990 Ski View Loop
- 13050 Ski View Loop
- 13017 Ski View Loop
- 13066 Ski View Loop
- 12976 Ski View Loop
- 13005 Ski View Loop
- 13985 Ski View Loop Unit 4
- 13985 Ski View Loop
- 12866 Ski View Loop
- 12766 Ski View Loop
- 13984 Ski View Loop
- 13742 Ski View Loop
- 13033 Ski View Loop
- 12991 Skiview Loop
- 13049 Ski View Loop
- 13082 Ski View Loop
- 12962 Ski View Loop
- 12977 Skiview Loop
Your Personal Tour Guide
Ask me questions while you tour the home.