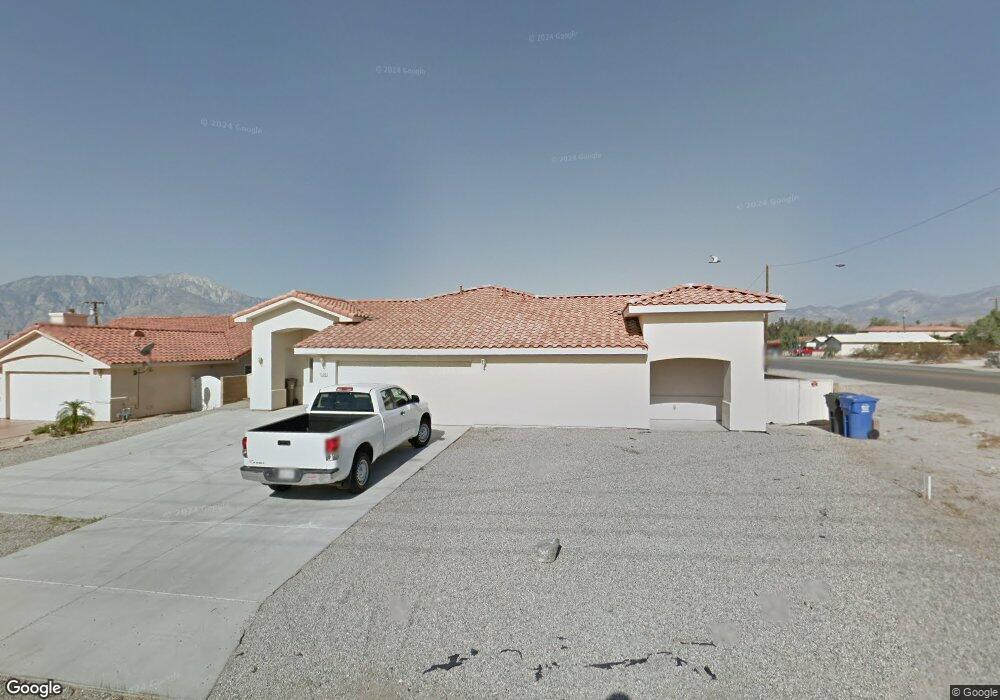
13019 Caliente Dr Unit A And B Desert Hot Springs, CA 92240
Estimated Value: $486,000 - $625,000
6
Beds
4
Baths
2,980
Sq Ft
$192/Sq Ft
Est. Value
About This Home
This home is located at 13019 Caliente Dr Unit A And B, Desert Hot Springs, CA 92240 and is currently estimated at $573,333, approximately $192 per square foot. 13019 Caliente Dr Unit A And B is a home located in Riverside County with nearby schools including Two Bunch Palms Elementary School, Painted Hills Middle School, and Desert Hot Springs High School.
Ownership History
Date
Name
Owned For
Owner Type
Purchase Details
Closed on
Apr 5, 2022
Sold by
Olivia Dircio
Bought by
Dircio Olivia and Alcaraz Janice Rubi
Current Estimated Value
Purchase Details
Closed on
Jun 7, 2021
Sold by
Rubi Alcaraz Janice
Bought by
Dircio Olivia
Purchase Details
Closed on
Apr 7, 2016
Sold by
Dircio Evlin Pastenes
Bought by
Dircio Olivia
Purchase Details
Closed on
May 7, 2008
Sold by
Jofran Development Inc
Bought by
Pastenes Evlin
Home Financials for this Owner
Home Financials are based on the most recent Mortgage that was taken out on this home.
Original Mortgage
$262,800
Interest Rate
6.07%
Mortgage Type
Commercial
Purchase Details
Closed on
Nov 29, 2006
Sold by
Montes Luciano M and Montes Becky
Bought by
Jofran Development Inc
Purchase Details
Closed on
Apr 15, 2003
Sold by
Jacobsen Sylvan Gardner
Bought by
Montes Luciano M and Montes Becky
Create a Home Valuation Report for This Property
The Home Valuation Report is an in-depth analysis detailing your home's value as well as a comparison with similar homes in the area
Home Values in the Area
Average Home Value in this Area
Purchase History
| Date | Buyer | Sale Price | Title Company |
|---|---|---|---|
| Dircio Olivia | -- | None Listed On Document | |
| Dircio Olivia | -- | None Listed On Document | |
| Dircio Olivia | -- | None Available | |
| Pastenes Evlin | $328,500 | None Available | |
| Jofran Development Inc | $95,000 | First American Title Co | |
| Montes Luciano M | $9,000 | Landsafe Title |
Source: Public Records
Mortgage History
| Date | Status | Borrower | Loan Amount |
|---|---|---|---|
| Previous Owner | Pastenes Evlin | $262,800 |
Source: Public Records
Tax History Compared to Growth
Tax History
| Year | Tax Paid | Tax Assessment Tax Assessment Total Assessment is a certain percentage of the fair market value that is determined by local assessors to be the total taxable value of land and additions on the property. | Land | Improvement |
|---|---|---|---|---|
| 2025 | $6,034 | $423,006 | $105,742 | $317,264 |
| 2023 | $6,034 | $405,814 | $48,698 | $357,116 |
| 2022 | $5,830 | $368,922 | $44,271 | $324,651 |
| 2021 | $4,929 | $299,936 | $35,992 | $263,944 |
| 2020 | $4,384 | $267,800 | $32,136 | $235,664 |
| 2019 | $4,284 | $260,000 | $31,200 | $228,800 |
| 2018 | $4,114 | $250,000 | $30,000 | $220,000 |
| 2017 | $4,068 | $250,000 | $40,000 | $210,000 |
| 2016 | $2,817 | $165,000 | $30,000 | $135,000 |
| 2015 | $2,121 | $165,000 | $30,000 | $135,000 |
| 2014 | $2,135 | $165,000 | $15,000 | $150,000 |
Source: Public Records
Map
Nearby Homes
- 13165 Ramona Dr
- 0 Estrella Ave
- 66425 Desert View Ave
- 0 Ocotillo & Flora St Unit 219137167PS
- 13547 Caliente Dr
- 01 Desert View Ave
- 12340 Cactus Dr
- 0 Cactus Dr Unit 219129874DA
- 0 Cactus Dr Unit 219124135DA
- 0 Linteau Ln Unit 219131666DA
- 13423 Ramona Dr
- 13405 Ocotillo Rd
- 66385 Cahuilla Ave
- 66270 Desert View Ave
- 66353 Cahuilla Ave
- 66254 Desert View Ave
- 0 Joseph Way Unit 219122901DA
- 0 Cahuilla Ave Unit 219133494DA
- 66590 Joseph Way
- 0 Palm Dr Unit 25559703PS
- 13019 Caliente Dr Unit A-B
- 13019 Caliente Dr
- 13037 Caliente Dr
- 13113 Caliente Dr
- 13024 Caliente Dr
- 66404 Hacienda Ave
- 66414 Hacienda Ave
- 13040 Caliente Dr
- 66400 Hacienda Ave
- 13062 Caliente Dr
- 66424 Hacienda Ave
- 13100 La Mesa Dr
- 0 La Mesa Unit 15-966887PS
- 0 La Mesa Unit 17-207938PS
- 0 La Mesa Unit 23-326429
- 0 La Mesa Unit GD23162308
- 0 La Mesa Unit GD23001408
- 0 La Mesa Unit 219071845DA
- 0 La Mesa Unit 217022480DA
- 0 La Mesa Unit 17207938DA