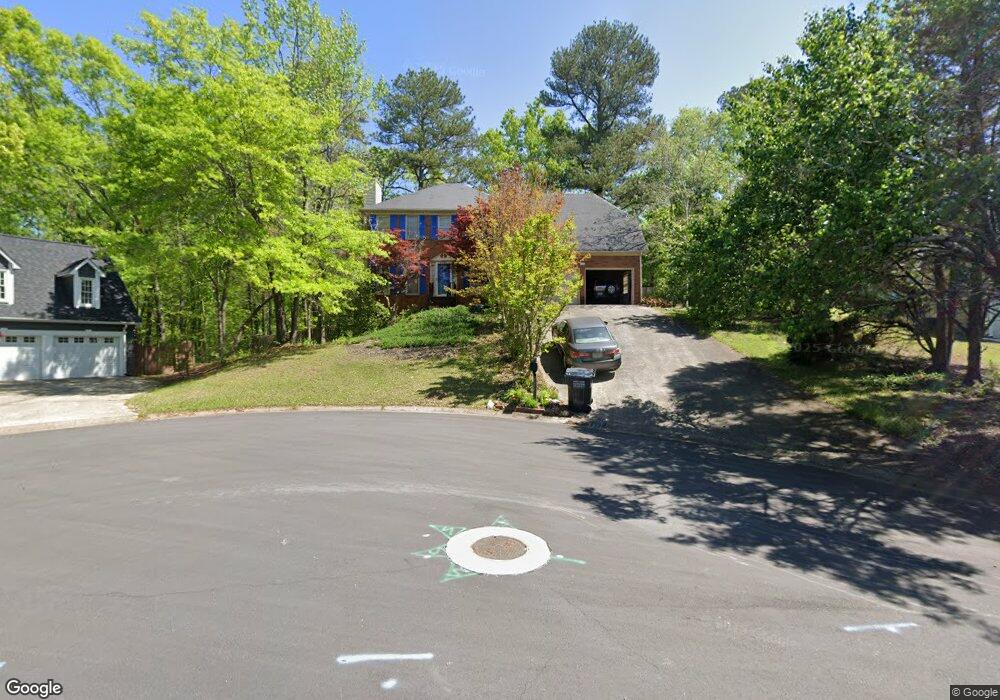
1302 Bustling Ln SW Marietta, GA 30064
West Cobb NeighborhoodEstimated Value: $406,181 - $442,000
3
Beds
3
Baths
1,971
Sq Ft
$215/Sq Ft
Est. Value
About This Home
This home is located at 1302 Bustling Ln SW, Marietta, GA 30064 and is currently estimated at $423,045, approximately $214 per square foot. 1302 Bustling Ln SW is a home located in Cobb County with nearby schools including Cheatham Hill Elementary School, Lovinggood Middle School, and Hillgrove High School.
Ownership History
Date
Name
Owned For
Owner Type
Purchase Details
Closed on
Feb 19, 2002
Sold by
Pmi Mtg Insurance Co
Bought by
Asberry Lee and Asberry Cheryl
Current Estimated Value
Home Financials for this Owner
Home Financials are based on the most recent Mortgage that was taken out on this home.
Original Mortgage
$137,750
Outstanding Balance
$51,104
Interest Rate
5.75%
Mortgage Type
New Conventional
Estimated Equity
$371,941
Purchase Details
Closed on
Apr 3, 2001
Sold by
Citimortgage Inc
Bought by
Federal National Mortgage Association
Purchase Details
Closed on
Aug 29, 1997
Sold by
Bradshaw Carlos N
Bought by
Thompson John D and Thompson Denise H
Home Financials for this Owner
Home Financials are based on the most recent Mortgage that was taken out on this home.
Original Mortgage
$126,900
Interest Rate
7.46%
Mortgage Type
New Conventional
Purchase Details
Closed on
Jul 28, 1995
Sold by
Petrinovich Karl J
Bought by
Bradshaw Carlos N
Create a Home Valuation Report for This Property
The Home Valuation Report is an in-depth analysis detailing your home's value as well as a comparison with similar homes in the area
Home Values in the Area
Average Home Value in this Area
Purchase History
| Date | Buyer | Sale Price | Title Company |
|---|---|---|---|
| Asberry Lee | $145,000 | -- | |
| Federal National Mortgage Association | -- | -- | |
| Citimortgage Inc | $132,258 | -- | |
| Thompson John D | $130,900 | -- | |
| Bradshaw Carlos N | $117,500 | -- |
Source: Public Records
Mortgage History
| Date | Status | Borrower | Loan Amount |
|---|---|---|---|
| Open | Asberry Lee | $137,750 | |
| Previous Owner | Thompson John D | $126,900 | |
| Closed | Bradshaw Carlos N | $0 |
Source: Public Records
Tax History Compared to Growth
Tax History
| Year | Tax Paid | Tax Assessment Tax Assessment Total Assessment is a certain percentage of the fair market value that is determined by local assessors to be the total taxable value of land and additions on the property. | Land | Improvement |
|---|---|---|---|---|
| 2025 | $817 | $153,796 | $20,000 | $133,796 |
| 2024 | $820 | $153,796 | $20,000 | $133,796 |
| 2023 | $614 | $153,796 | $20,000 | $133,796 |
| 2022 | $664 | $101,620 | $20,000 | $81,620 |
| 2021 | $664 | $101,620 | $20,000 | $81,620 |
| 2020 | $643 | $94,516 | $16,800 | $77,716 |
| 2019 | $643 | $94,516 | $16,800 | $77,716 |
| 2018 | $605 | $81,748 | $16,800 | $64,948 |
| 2017 | $1,897 | $81,748 | $16,800 | $64,948 |
| 2016 | $1,675 | $71,544 | $15,960 | $55,584 |
| 2015 | $1,713 | $71,544 | $15,960 | $55,584 |
| 2014 | $1,486 | $60,900 | $0 | $0 |
Source: Public Records
Map
Nearby Homes
- 2563 Irwin Lake Overlook Rd SW
- 2403 Bonshaw Ln
- 1239 Bonshaw Trail Unit 3
- 1209 Wilkes Way SW Unit 1
- 1227 Bonshaw Trail
- 1214 Bonshaw Trail
- 1518 Sage Ridge Dr
- 2613 Lakefield Ct
- 1331 Wynford Chase SW Unit 1
- 1884 Dovonshire Rd SW
- 2341 Habersham Dr SW
- 1841 Edington Rd SW
- 1237 Wynford Woods SW
- 1843 Edington Rd SW
- 1642 Ashmar Ln SW
- 994 Gentry Ln SW
- 1853 Edington Rd SW
- 1265 Channel Park SW
- 2093 Breconridge Dr SW
- 3033 Addie Pond Way SW
- 1300 Bustling Ln SW
- 1450 Wind Breeze Way SW
- 1450 Windbreeze Way SW
- 2421 Southern Oak Dr SW Unit 1
- 1458 Wind Breeze Way SW
- 1301 Bustling Ln SW Unit 1
- 1303 Bustling Ln SW
- 2422 Southern Oak Dr SW
- 2419 Southern Oak Dr SW
- 1305 Bustling Ln SW
- 1306 Bustling Ln SW
- 2420 Southern Oak Dr SW Unit 1
- 1451 Wind Breeze Way SW
- 1307 Bustling Ln SW
- 1453 Wind Breeze Way SW Unit 1
- 1455 Wind Breeze Way SW
- 2416 Southern Oak Dr SW Unit 1
- 1457 Wind Breeze Way SW
- 2417 Southern Oak Dr SW
- 2383 Stirring Ct SW