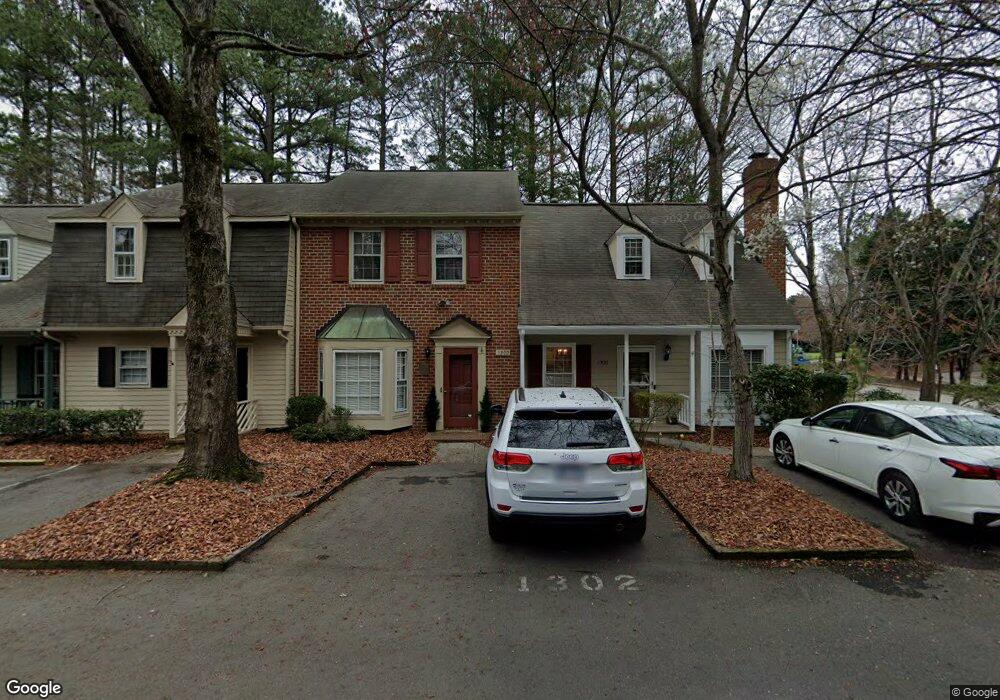
1302 Dylan Heath Ct Raleigh, NC 27608
Sunset Hills NeighborhoodEstimated Value: $368,910 - $408,000
2
Beds
2
Baths
1,178
Sq Ft
$333/Sq Ft
Est. Value
About This Home
This home is located at 1302 Dylan Heath Ct, Raleigh, NC 27608 and is currently estimated at $391,978, approximately $332 per square foot. 1302 Dylan Heath Ct is a home located in Wake County with nearby schools including Lacy Elementary, Oberlin Middle School, and Broughton Magnet High School.
Ownership History
Date
Name
Owned For
Owner Type
Purchase Details
Closed on
Oct 14, 2002
Sold by
Cendant Mobility Financial Corp
Bought by
Cochran Benjamin T and Cochran Christine M
Current Estimated Value
Home Financials for this Owner
Home Financials are based on the most recent Mortgage that was taken out on this home.
Original Mortgage
$119,200
Outstanding Balance
$49,425
Interest Rate
6.01%
Estimated Equity
$342,553
Purchase Details
Closed on
Oct 8, 2002
Sold by
Clark Darren Burke and Clark Elizabeth S
Bought by
Cendant Mobility Financial Corp
Home Financials for this Owner
Home Financials are based on the most recent Mortgage that was taken out on this home.
Original Mortgage
$119,200
Outstanding Balance
$49,425
Interest Rate
6.01%
Estimated Equity
$342,553
Purchase Details
Closed on
Apr 30, 1999
Sold by
Dunn Mary Noelle
Bought by
Clark Darren Burke
Home Financials for this Owner
Home Financials are based on the most recent Mortgage that was taken out on this home.
Original Mortgage
$117,000
Interest Rate
5.25%
Create a Home Valuation Report for This Property
The Home Valuation Report is an in-depth analysis detailing your home's value as well as a comparison with similar homes in the area
Home Values in the Area
Average Home Value in this Area
Purchase History
| Date | Buyer | Sale Price | Title Company |
|---|---|---|---|
| Cochran Benjamin T | $149,000 | -- | |
| Cendant Mobility Financial Corp | $149,000 | -- | |
| Clark Darren Burke | $130,000 | -- |
Source: Public Records
Mortgage History
| Date | Status | Borrower | Loan Amount |
|---|---|---|---|
| Open | Cochran Benjamin T | $119,200 | |
| Previous Owner | Clark Darren Burke | $117,000 |
Source: Public Records
Tax History
| Year | Tax Paid | Tax Assessment Tax Assessment Total Assessment is a certain percentage of the fair market value that is determined by local assessors to be the total taxable value of land and additions on the property. | Land | Improvement |
|---|---|---|---|---|
| 2025 | $2,983 | $339,748 | $140,000 | $199,748 |
| 2024 | $2,971 | $339,748 | $140,000 | $199,748 |
Source: Public Records
Map
Nearby Homes
- 1314 Dylan Heath Ct
- 1201 Weldon Place
- 2317 Pettiford Rd
- 2312 Grant Ave
- 2600 Wade Ave
- 2315 Pettiford Rd
- 1319 Chester Rd
- 1347 Chester Rd
- 1306 Mayfair Rd
- 2304 Grant Ave
- 1303 Chamblee Hill Ct
- 1307 Chamblee Hill Ct
- 2301 Grant Ave
- 1304 Chamblee Hill Ct
- 1308 Chamblee Hill Ct
- 1312 Chamblee Hill Ct
- 924 Tower St
- 1009 Parker St
- 2159 Mayview Rd Unit B
- 922 Tower St
- 1304 Dylan Heath Ct
- 1306 Dylan Heath Ct
- 1303 Cameron View Ct
- 1305 Cameron View Ct
- 1301 Cameron View Ct
- 1310 Dylan Heath Ct
- 1309 Cameron View Ct
- 1312 Dylan Heath Ct
- 1305 Dylan Heath Ct
- 1311 Cameron View Ct
- 1301 Dylan Heath Ct
- 1307 Dylan Heath Ct
- 1321 Cameron View Ct
- 1348 Dylan Heath Ct
- 1311 Dylan Heath Ct
- 1323 Cameron View Ct
- 1316 Dylan Heath Ct
- 1325 Cameron View Ct
- 2346 Wade Ave
- 2324 Wade Ave
Your Personal Tour Guide
Ask me questions while you tour the home.