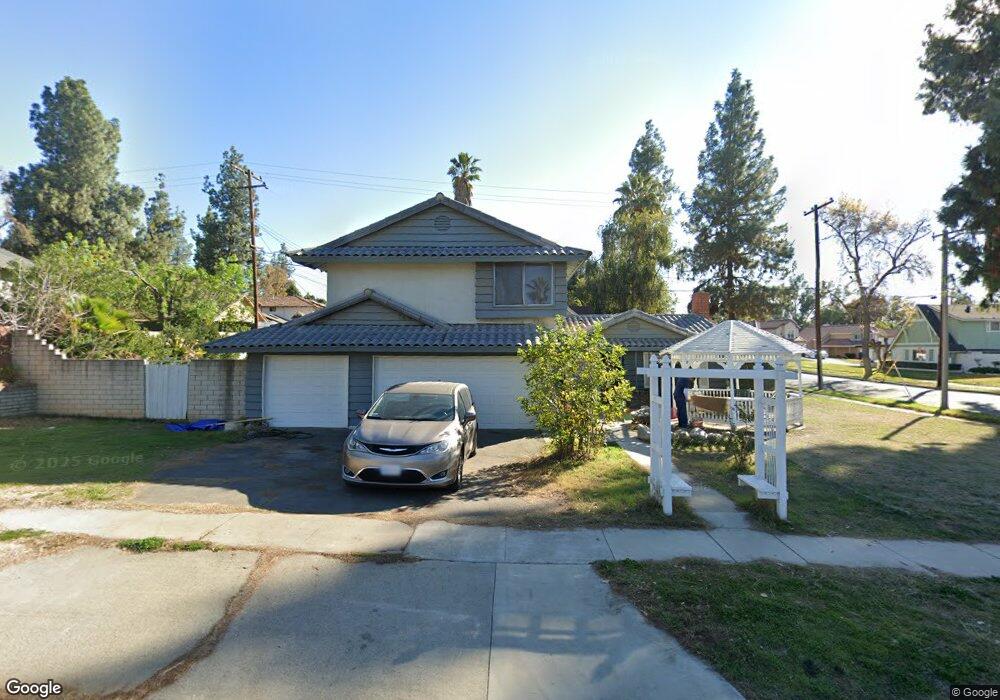
1302 Morrison Dr Redlands, CA 92374
South Redlands NeighborhoodEstimated Value: $643,000 - $712,221
5
Beds
3
Baths
2,046
Sq Ft
$336/Sq Ft
Est. Value
About This Home
This home is located at 1302 Morrison Dr, Redlands, CA 92374 and is currently estimated at $688,305, approximately $336 per square foot. 1302 Morrison Dr is a home located in San Bernardino County with nearby schools including Mariposa Elementary School, Moore Middle School, and Redlands East Valley High School.
Ownership History
Date
Name
Owned For
Owner Type
Purchase Details
Closed on
Dec 10, 1999
Sold by
Walker Orelious
Bought by
Vogt Daniel A
Current Estimated Value
Home Financials for this Owner
Home Financials are based on the most recent Mortgage that was taken out on this home.
Original Mortgage
$92,000
Outstanding Balance
$28,735
Interest Rate
7.83%
Estimated Equity
$659,570
Create a Home Valuation Report for This Property
The Home Valuation Report is an in-depth analysis detailing your home's value as well as a comparison with similar homes in the area
Home Values in the Area
Average Home Value in this Area
Purchase History
| Date | Buyer | Sale Price | Title Company |
|---|---|---|---|
| Vogt Daniel A | $158,000 | Fidelity National Title | |
| Walker Orelious | -- | Fidelity National Title Co |
Source: Public Records
Mortgage History
| Date | Status | Borrower | Loan Amount |
|---|---|---|---|
| Open | Vogt Daniel A | $92,000 |
Source: Public Records
Tax History
| Year | Tax Paid | Tax Assessment Tax Assessment Total Assessment is a certain percentage of the fair market value that is determined by local assessors to be the total taxable value of land and additions on the property. | Land | Improvement |
|---|---|---|---|---|
| 2025 | $2,956 | $242,844 | $60,712 | $182,132 |
| 2024 | $2,760 | $238,083 | $59,522 | $178,561 |
| 2023 | $2,755 | $233,415 | $58,355 | $175,060 |
| 2022 | $2,714 | $228,838 | $57,211 | $171,627 |
| 2021 | $2,762 | $224,351 | $56,089 | $168,262 |
| 2020 | $2,720 | $222,051 | $55,514 | $166,537 |
| 2019 | $2,643 | $217,697 | $54,425 | $163,272 |
| 2018 | $2,576 | $213,429 | $53,358 | $160,071 |
| 2017 | $2,552 | $209,244 | $52,312 | $156,932 |
| 2016 | $2,522 | $205,141 | $51,286 | $153,855 |
| 2015 | $2,502 | $202,060 | $50,516 | $151,544 |
| 2014 | $2,456 | $198,101 | $49,526 | $148,575 |
Source: Public Records
Map
Nearby Homes
- 705 Hemlock Ct
- 1032 Ardmore Cir
- 1049 Evergreen Ct
- 15 Naomi St
- 455 Judson St Unit 9
- 709 Bermuda Dr
- 450 Judson St Unit 94
- 1454 E Highland Ave
- 1479 Moore St
- 1442 Moore St
- 1452 Moore St
- 1458 Moore St
- 1472 Moore St
- 1415 Stillman Ave
- 61 Sparrow Ct
- 1410 Pleasantview Dr
- 56 Dearborn Cir
- 1055 Roosevelt Rd
- 1562 E Citrus Ave
- 635 E Palm Ave
- 705 S Grove St
- 1306 Morrison Dr
- 704 Hemlock Ct
- 709 S Grove St
- 1301 Morrison Dr
- 700 S Grove St
- 1305 Morrison Dr
- 708 Hemlock Ct
- 1309 Morrison Dr
- 1261 Morrison Dr
- 713 S Grove St
- 712 Hemlock Ct
- 701 Hemlock Ct
- 1313 Morrison Dr
- 1300 E Citrus Ave
- 1257 Morrison Dr
- 1304 E Citrus Ave
- 1256 Morrison Dr
- 721 Napa Ave
- 717 S Grove St
Your Personal Tour Guide
Ask me questions while you tour the home.