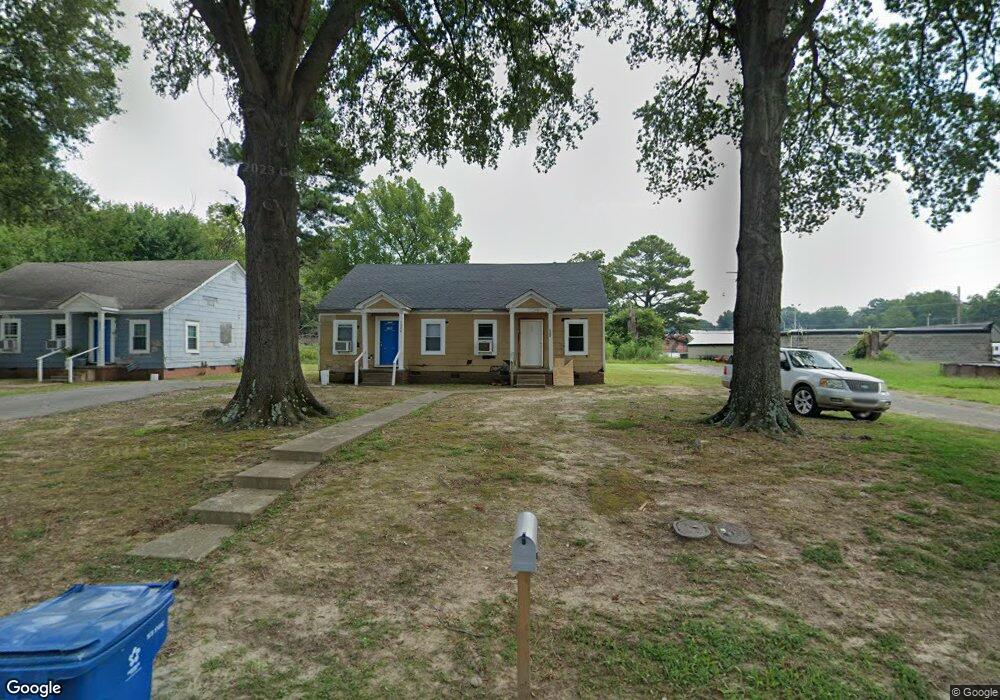
1302 N 22nd Ave Unit 1304 Humboldt, TN 38343
Estimated Value: $48,000 - $72,110
--
Bed
2
Baths
1,470
Sq Ft
$41/Sq Ft
Est. Value
About This Home
This home is located at 1302 N 22nd Ave Unit 1304, Humboldt, TN 38343 and is currently estimated at $59,778, approximately $40 per square foot. 1302 N 22nd Ave Unit 1304 is a home located in Gibson County with nearby schools including Stigall Primary School, East Elementary School, and Humboldt Middle School.
Ownership History
Date
Name
Owned For
Owner Type
Purchase Details
Closed on
Dec 31, 2020
Sold by
Harper Charlie L and Charlie L Harper Reunited Prop
Bought by
Robinson David A
Current Estimated Value
Purchase Details
Closed on
Jul 2, 2018
Sold by
York Brad M
Bought by
Charlie L Harper Reunited Properties
Purchase Details
Closed on
Jan 16, 2018
Sold by
Aston William H
Bought by
York Brad M and York Courtney L
Purchase Details
Closed on
Jan 20, 2015
Sold by
Benedict Robert J
Bought by
Aston William H
Purchase Details
Closed on
Dec 9, 1996
Bought by
Benedict Enterprise Inc
Purchase Details
Closed on
Sep 1, 1993
Bought by
Hawks Michael S
Purchase Details
Closed on
Aug 1, 1988
Bought by
Fitzgerald Phillip H and Nora Rebecca
Purchase Details
Closed on
Dec 3, 1986
Bought by
Clover Corporation
Purchase Details
Closed on
Aug 1, 1964
Create a Home Valuation Report for This Property
The Home Valuation Report is an in-depth analysis detailing your home's value as well as a comparison with similar homes in the area
Home Values in the Area
Average Home Value in this Area
Purchase History
| Date | Buyer | Sale Price | Title Company |
|---|---|---|---|
| Robinson David A | $6,000 | None Available | |
| Charlie L Harper Reunited Properties | $6,250 | -- | |
| York Brad M | $3,000 | -- | |
| Aston William H | $70,000 | -- | |
| Benedict Enterprise Inc | $125,000 | -- | |
| Hawks Michael S | $57,000 | -- | |
| Fitzgerald Phillip H | $45,600 | -- | |
| Clover Corporation | -- | -- | |
| -- | -- | -- |
Source: Public Records
Tax History Compared to Growth
Tax History
| Year | Tax Paid | Tax Assessment Tax Assessment Total Assessment is a certain percentage of the fair market value that is determined by local assessors to be the total taxable value of land and additions on the property. | Land | Improvement |
|---|---|---|---|---|
| 2024 | $358 | $13,200 | $4,400 | $8,800 |
| 2023 | $81 | $7,320 | $2,400 | $4,920 |
| 2022 | $76 | $7,320 | $2,400 | $4,920 |
| 2021 | $76 | $7,320 | $2,400 | $4,920 |
| 2020 | $276 | $7,320 | $2,400 | $4,920 |
| 2019 | $276 | $7,320 | $2,400 | $4,920 |
| 2018 | $368 | $9,080 | $2,400 | $6,680 |
| 2017 | $364 | $9,080 | $2,400 | $6,680 |
| 2016 | $401 | $10,000 | $2,400 | $7,600 |
| 2015 | $397 | $10,000 | $2,400 | $7,600 |
| 2014 | -- | $10,000 | $2,400 | $7,600 |
Source: Public Records
Map
Nearby Homes
- 2107 Campbell St
- 811 N 24th Ave
- 1338 Dungan St
- 1438 N 19th Ave
- 1416 N 18th Ave
- 2508 Vine St
- 0 +-6 Acres Gadsden Todd Levee Unit 241321
- 1325 N 17th Ave
- 2425 St Mary Dr
- 2162 Dodson St
- 1907 E Mitchell St
- 700 N 18th Ave
- 00000 Lot 7 Mullins St
- 0000 lot 6-C Mullins St
- 000Lot 6-B Mullins St
- 00-lot 6-A Mullins St
- 1211 N 29th Ave
- 2310 Dodson St
- 1509 Vine St
- 700 N 29th Ave
- 1308 N 22nd Ave Unit 1306
- 2213 Calhoun St Unit 2215
- 1206 N 22nd Ave
- 1314 N 22nd Ave
- 1303 N 22nd Ave
- 1207 N 22nd Ave
- 1305 N 22nd Ave
- 1315 N 22nd Ave
- 1309 N 22nd Ave
- 2257 Eastend Dr
- 2028 Calhoun St
- 1316 N 22nd Ave
- 1319 N 22nd Ave
- 1200 N 22nd Ave Unit A
- 2267 Eastend Dr
- 2024 Calhoun St
- 2017 Calhoun St
- 1115 N 22nd Ave
- 1323 N 22nd Ave
- 1330 N 22nd Ave