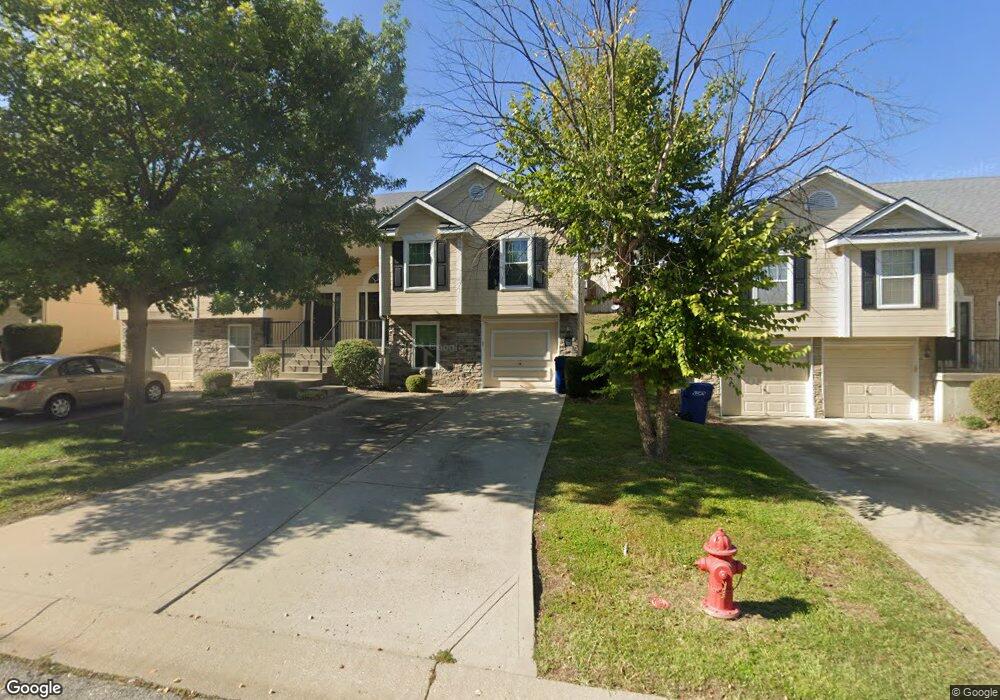
1302 NW Ashley Ln Grain Valley, MO 64029
Estimated Value: $184,000 - $236,995
2
Beds
2
Baths
947
Sq Ft
$214/Sq Ft
Est. Value
About This Home
This home is located at 1302 NW Ashley Ln, Grain Valley, MO 64029 and is currently estimated at $202,999, approximately $214 per square foot. 1302 NW Ashley Ln is a home located in Jackson County with nearby schools including Grain Valley High School.
Ownership History
Date
Name
Owned For
Owner Type
Purchase Details
Closed on
Oct 7, 2010
Sold by
Federal Home Loan Mortgage Corporation
Bought by
Smith Donna L
Current Estimated Value
Home Financials for this Owner
Home Financials are based on the most recent Mortgage that was taken out on this home.
Original Mortgage
$78,756
Interest Rate
4.27%
Mortgage Type
New Conventional
Purchase Details
Closed on
Apr 19, 2010
Sold by
Hoyt Michael and Willis Troy
Bought by
Onewest Bank Fsb
Purchase Details
Closed on
Apr 12, 2010
Sold by
Onewest Bank Fsb
Bought by
Federal Home Loan Mortgage Corp
Purchase Details
Closed on
Jun 8, 2007
Sold by
Valley Hills Real Estate Partners Llc
Bought by
Hoyt Michael
Home Financials for this Owner
Home Financials are based on the most recent Mortgage that was taken out on this home.
Original Mortgage
$112,425
Interest Rate
7.12%
Mortgage Type
Purchase Money Mortgage
Create a Home Valuation Report for This Property
The Home Valuation Report is an in-depth analysis detailing your home's value as well as a comparison with similar homes in the area
Home Values in the Area
Average Home Value in this Area
Purchase History
| Date | Buyer | Sale Price | Title Company |
|---|---|---|---|
| Smith Donna L | -- | Continental Title | |
| Onewest Bank Fsb | $116,788 | None Available | |
| Federal Home Loan Mortgage Corp | -- | None Available | |
| Hoyt Michael | -- | Commonwealth Title |
Source: Public Records
Mortgage History
| Date | Status | Borrower | Loan Amount |
|---|---|---|---|
| Previous Owner | Smith Donna L | $78,756 | |
| Previous Owner | Hoyt Michael | $112,425 |
Source: Public Records
Tax History Compared to Growth
Tax History
| Year | Tax Paid | Tax Assessment Tax Assessment Total Assessment is a certain percentage of the fair market value that is determined by local assessors to be the total taxable value of land and additions on the property. | Land | Improvement |
|---|---|---|---|---|
| 2025 | $2,153 | $30,054 | $986 | $29,068 |
| 2024 | $2,072 | $26,135 | $625 | $25,510 |
| 2023 | $2,072 | $26,135 | $1,180 | $24,955 |
| 2022 | $2,256 | $24,890 | $323 | $24,567 |
| 2021 | $2,203 | $24,890 | $323 | $24,567 |
| 2020 | $1,965 | $21,889 | $323 | $21,566 |
| 2019 | $1,925 | $21,889 | $323 | $21,566 |
| 2018 | $1,786 | $18,982 | $2,406 | $16,576 |
| 2017 | $1,786 | $18,982 | $2,406 | $16,576 |
| 2016 | $1,741 | $18,506 | $2,964 | $15,542 |
| 2014 | $1,557 | $16,436 | $3,126 | $13,310 |
Source: Public Records
Map
Nearby Homes
- 1235 NW Ashley Ln
- 1206 NW Baytree Dr
- 1211 NW Scenic Dr
- 1007 NW Long Dr
- 605 NW Silverstone Cir
- 704 NW Eagle Dr
- 708 Pavillion Dr
- 2601 NE Wheatley Dr
- 2512 NE Wheatley Dr
- 2513 NE Wheatley Dr
- 2700 NE Crestview St
- 2701 NE Crestview St
- 1208 NW Golfview Dr
- 2705 NE Wheatley Dr
- 2601 NE Crestview St
- 2613 NE Amanda Ln
- 2601 NE Amanda Ln
- 2704 NE Amanda Ln
- 1418 SW Blue Branch Dr
- 1402 NW Broadway Throughway
- 1234 NW Ashley Ln
- 1232 NW Ashley Ln
- 1226 NW Ashley Ln
- 1303 NW Ashley Dr
- 1233 NW Ashley Ln
- 1228 NW Ashley Ln
- 1235 NW Ashley Dr
- 1305 NW Ashley Dr
- 1233 NW Ashley Dr
- 1303 NW Ashley Ln Unit 17
- 1303 NW Ashley Ln
- 1231 NW Ashley Ln
- 1305 NW Ashley Ln
- 1231 NW Ashley Dr
- 1307 NW Ashley Ln
- 1309 NW Ashley Ln
- 1227 NW Ashley Ln
- 1227 NW Ashley Dr
- 1225 NW Ashley Ln
- 1223 NW Ashley Ln