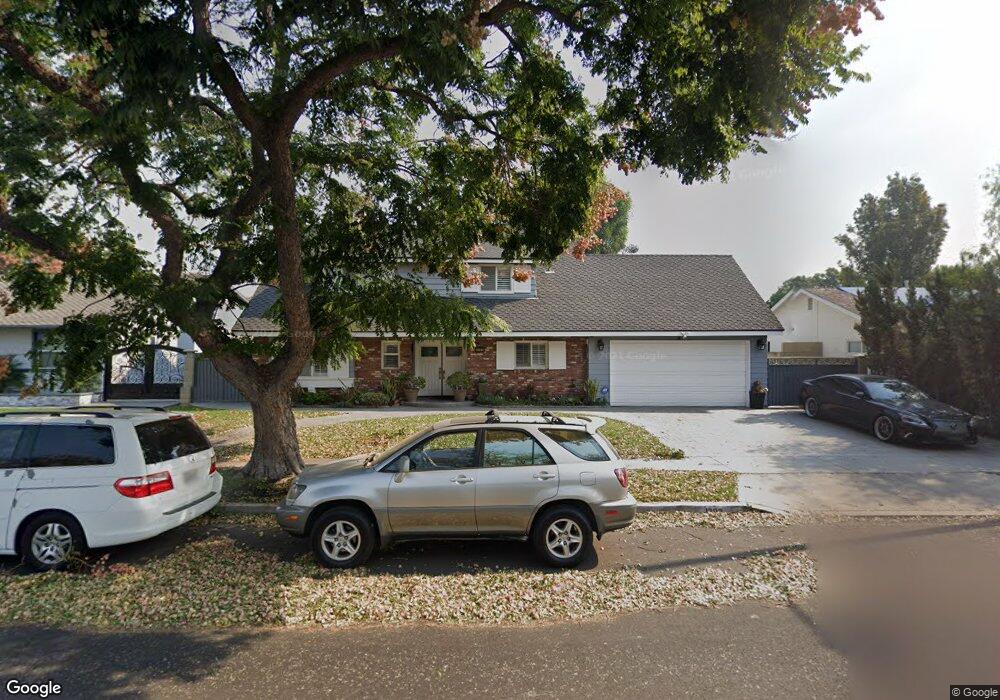
1302 S Kings Court Dr Anaheim, CA 92804
Hermosa Village NeighborhoodEstimated Value: $1,052,000 - $1,175,000
4
Beds
2
Baths
2,228
Sq Ft
$501/Sq Ft
Est. Value
About This Home
This home is located at 1302 S Kings Court Dr, Anaheim, CA 92804 and is currently estimated at $1,116,342, approximately $501 per square foot. 1302 S Kings Court Dr is a home located in Orange County with nearby schools including James Madison Elementary School, Ball Junior High School, and Loara High School.
Ownership History
Date
Name
Owned For
Owner Type
Purchase Details
Closed on
Dec 10, 2024
Sold by
Funchain Thanadet and Funchain Sakaokarn
Bought by
Funchain Thanadet and Funchain Sakaokarn
Current Estimated Value
Purchase Details
Closed on
May 26, 2010
Sold by
Liou Wen Shou
Bought by
Funchain Thanadet and Funchain Sakaokarn
Home Financials for this Owner
Home Financials are based on the most recent Mortgage that was taken out on this home.
Original Mortgage
$373,600
Interest Rate
4.76%
Mortgage Type
New Conventional
Purchase Details
Closed on
Feb 17, 1999
Sold by
Hsia Tao Chen Ai
Bought by
Liou Wen Shou and Hsia Family Surviving Spouses Trust
Purchase Details
Closed on
Mar 20, 1995
Sold by
Hsia Wen Tsao and Hsia T
Bought by
Hsia Wen Tsao and Hsia Tao Chen Ai
Create a Home Valuation Report for This Property
The Home Valuation Report is an in-depth analysis detailing your home's value as well as a comparison with similar homes in the area
Home Values in the Area
Average Home Value in this Area
Purchase History
| Date | Buyer | Sale Price | Title Company |
|---|---|---|---|
| Funchain Thanadet | -- | None Listed On Document | |
| Funchain Thanadet | -- | None Listed On Document | |
| Funchain Thanadet | $467,000 | Security Union Title Pacific | |
| Liou Wen Shou | -- | -- | |
| Liou Wen Shou | -- | -- | |
| Hsia Wen Tsao | -- | -- |
Source: Public Records
Mortgage History
| Date | Status | Borrower | Loan Amount |
|---|---|---|---|
| Previous Owner | Funchain Thanadet | $373,600 |
Source: Public Records
Tax History Compared to Growth
Tax History
| Year | Tax Paid | Tax Assessment Tax Assessment Total Assessment is a certain percentage of the fair market value that is determined by local assessors to be the total taxable value of land and additions on the property. | Land | Improvement |
|---|---|---|---|---|
| 2025 | $6,761 | $598,301 | $448,208 | $150,093 |
| 2024 | $6,761 | $586,570 | $439,420 | $147,150 |
| 2023 | $6,619 | $575,069 | $430,804 | $144,265 |
| 2022 | $6,536 | $563,794 | $422,357 | $141,437 |
| 2021 | $6,547 | $552,740 | $414,076 | $138,664 |
| 2020 | $6,520 | $547,073 | $409,830 | $137,243 |
| 2019 | $6,321 | $536,347 | $401,795 | $134,552 |
| 2018 | $6,189 | $525,831 | $393,917 | $131,914 |
| 2017 | $5,941 | $515,521 | $386,193 | $129,328 |
| 2016 | $5,924 | $505,413 | $378,620 | $126,793 |
| 2015 | $5,872 | $497,822 | $372,933 | $124,889 |
| 2014 | $5,504 | $488,071 | $365,628 | $122,443 |
Source: Public Records
Map
Nearby Homes
- 1768 W Juno Ave
- 906 S Fann St
- 902 S Fann St
- 1629 W Ball Rd
- 930 S Emerald St
- 727 S Falcon St
- 1700 W Cerritos Ave Unit 216
- 1675 W Mells Ln
- 1913 W Beacon Ave
- 1564 W Palais Rd
- 1551 W Ball Rd
- 1944 W Lullaby Ln
- 633 S Echo St
- 1537 W Harriet Ln
- 1616 S Euclid St Unit 100
- 1616 S Euclid St Unit 75
- 1616 S Euclid St Unit 54
- 1616 S Euclid St Unit 23
- 938 S Gilbuck Dr
- 1531 W Doris Place
- 1302 S Kings Court Dr
- 1306 S Kings Court Dr
- 1230 S Kings Court Dr
- 1303 S Fann St
- 1750 W Bowling St
- 1766 W Goodhue Ave Unit A
- 1766 W Goodhue Ave
- 1766 W Goodhue Ave Unit B
- 1766 W Goodhue Ave Unit A
- 1766 W Goodhue Ave
- 1312 S Kings Court Dr
- 1307 S Fann St
- 1744 W Bowling St
- 1765 W Castle Ave
- 1765 W Goodhue Ave
- 1300 S Fann St
- 1770 W Goodhue Ave
- 1313 S Fann St
- 1318 S Kings Court Dr
- 1218 S Kings Court Dr