1302 Westmont Ct Southlake, TX 76092
Estimated Value: $1,322,345 - $1,470,000
4
Beds
4
Baths
4,107
Sq Ft
$348/Sq Ft
Est. Value
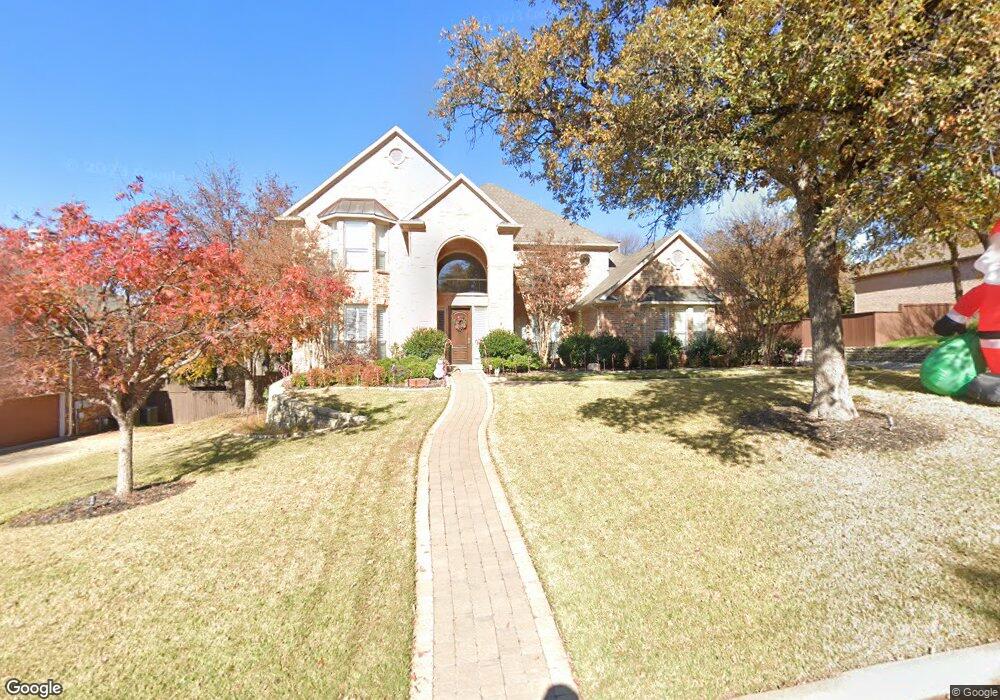
About This Home
This home is located at 1302 Westmont Ct, Southlake, TX 76092 and is currently estimated at $1,427,336, approximately $347 per square foot. 1302 Westmont Ct is a home located in Tarrant County with nearby schools including Old Union Elementary School, Eubanks Intermediate School, and George Dawson Middle School.
Ownership History
Date
Name
Owned For
Owner Type
Purchase Details
Closed on
Jul 7, 2025
Sold by
Brown Thomas
Bought by
Kral Rebecca
Current Estimated Value
Purchase Details
Closed on
Mar 15, 2021
Sold by
Meyer Mark Dale and Meyer Jacquelynn Dianne
Bought by
Kral Rebecca and Brown Thomas
Home Financials for this Owner
Home Financials are based on the most recent Mortgage that was taken out on this home.
Original Mortgage
$656,250
Interest Rate
2.7%
Mortgage Type
New Conventional
Purchase Details
Closed on
Jan 2, 2015
Sold by
Meyer Mark Dale and Meyer Jacquelynn Dianne
Bought by
Meyer Mark Dale and Meyer Jacquelynn Dianne
Purchase Details
Closed on
Feb 5, 1999
Sold by
Murchison Properties Inc
Bought by
Meyer Mark D and Meyer Jacquelynn D
Home Financials for this Owner
Home Financials are based on the most recent Mortgage that was taken out on this home.
Original Mortgage
$160,000
Interest Rate
6.79%
Create a Home Valuation Report for This Property
The Home Valuation Report is an in-depth analysis detailing your home's value as well as a comparison with similar homes in the area
Home Values in the Area
Average Home Value in this Area
Purchase History
| Date | Buyer | Sale Price | Title Company |
|---|---|---|---|
| Kral Rebecca | -- | None Listed On Document | |
| Kral Rebecca | -- | First American Title Ins Co | |
| Meyer Mark Dale | -- | None Available | |
| Meyer Mark D | -- | American Title Co |
Source: Public Records
Mortgage History
| Date | Status | Borrower | Loan Amount |
|---|---|---|---|
| Previous Owner | Kral Rebecca | $656,250 | |
| Previous Owner | Meyer Mark D | $160,000 |
Source: Public Records
Tax History Compared to Growth
Tax History
| Year | Tax Paid | Tax Assessment Tax Assessment Total Assessment is a certain percentage of the fair market value that is determined by local assessors to be the total taxable value of land and additions on the property. | Land | Improvement |
|---|---|---|---|---|
| 2025 | $16,820 | $1,052,000 | $346,050 | $705,950 |
| 2024 | $16,820 | $1,115,000 | $346,050 | $768,950 |
| 2023 | $18,268 | $1,173,000 | $346,050 | $826,950 |
| 2022 | $19,657 | $911,143 | $230,700 | $680,443 |
| 2021 | $17,002 | $805,851 | $230,700 | $575,151 |
| 2020 | $15,582 | $677,902 | $207,630 | $470,272 |
| 2019 | $18,454 | $806,119 | $150,000 | $656,119 |
| 2018 | $12,659 | $692,808 | $150,000 | $542,808 |
| 2017 | $16,690 | $673,366 | $150,000 | $523,366 |
| 2016 | $16,683 | $673,073 | $150,000 | $523,073 |
| 2015 | $12,472 | $577,600 | $80,000 | $497,600 |
| 2014 | $12,472 | $577,600 | $80,000 | $497,600 |
Source: Public Records
Map
Nearby Homes
- 1304 Kings Brook Ct
- 1577 Main St
- 1591 Main St
- 223 Westwood Dr
- 1532 Main St
- 702 Sussex Ct
- 350 Central Ave Unit 202
- 350 Central Ave Unit 503
- 350 Central Ave Unit 201
- 350 Central Ave Unit 307
- 350 Central Ave Unit 310
- 215 Park Ridge Blvd
- 231 Park Ridge Blvd
- 1032 Rosavine Dr
- 1028 Rosavine Dr
- 1017 Rosavine Dr
- 1004 Rosavine Dr
- 1020 Rosavine Dr
- 1012 Rosavine Dr
- 1024 Rosavine Dr
- 1300 Westmont Ct
- 1304 Westmont Ct
- 1224 Westmont Dr
- 1306 Westmont Ct
- 1303 Westmont Ct
- 1305 Westmont Ct
- 1301 Westmont Ct
- 1222 Westmont Dr
- 1307 Westmont Ct
- 1308 Westmont Ct
- 1221 Westmont Dr
- 1302 Forest Hills Ct
- 1309 Westmont Ct
- 1220 Westmont Dr
- 1300 Forest Hills Ct
- 1304 Forest Hills Ct
- 1306 Forest Hills Ct
- 1310 Westmont Ct
- 1219 Westmont Dr
- 1311 Westmont Ct