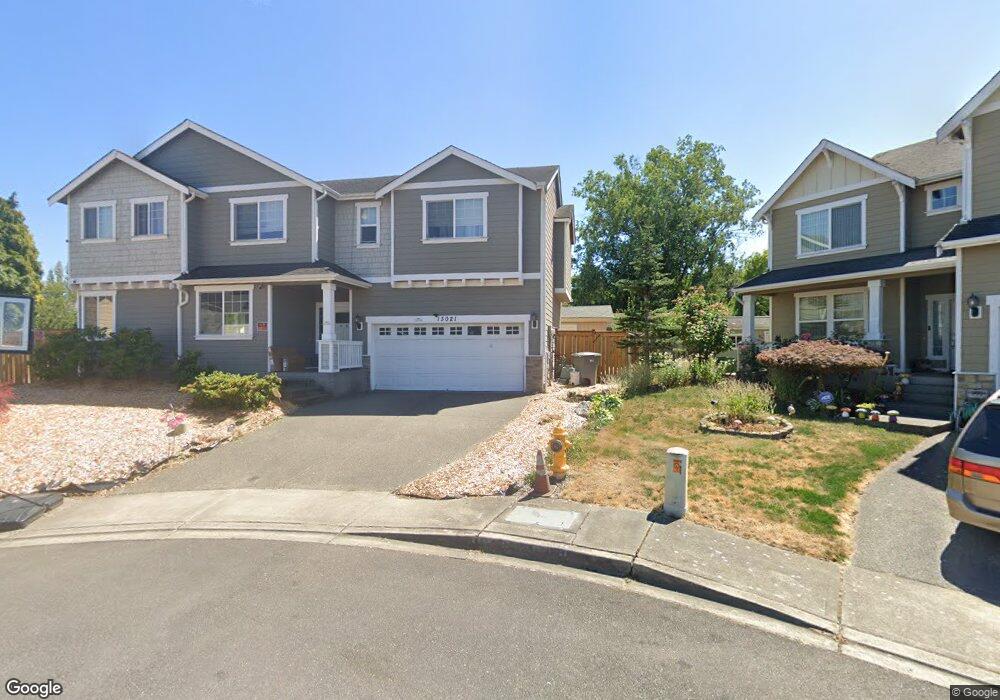
13021 38th Ln S Unit C4 Tukwila, WA 98168
Riverton NeighborhoodEstimated Value: $493,346 - $531,000
2
Beds
2
Baths
973
Sq Ft
$531/Sq Ft
Est. Value
About This Home
This home is located at 13021 38th Ln S Unit C4, Tukwila, WA 98168 and is currently estimated at $517,087, approximately $531 per square foot. 13021 38th Ln S Unit C4 is a home located in King County with nearby schools including Cascade View Elementary School, Thorndyke Elementary School, and Showalter Middle School.
Ownership History
Date
Name
Owned For
Owner Type
Purchase Details
Closed on
Nov 19, 2020
Sold by
Scharkowski Andre and Chen Li
Bought by
Scharkowski Andre and Chen Li
Current Estimated Value
Purchase Details
Closed on
May 25, 2007
Sold by
Gamache Adrien E
Bought by
Scharkowski Andre and Chen Li
Purchase Details
Closed on
May 13, 2005
Sold by
Gamache Kristi A
Bought by
Gamache Adrien E
Home Financials for this Owner
Home Financials are based on the most recent Mortgage that was taken out on this home.
Original Mortgage
$180,750
Interest Rate
6.02%
Mortgage Type
Fannie Mae Freddie Mac
Purchase Details
Closed on
May 6, 2005
Sold by
Ec Sterling Heights Llc
Bought by
Gamache Adrien E
Home Financials for this Owner
Home Financials are based on the most recent Mortgage that was taken out on this home.
Original Mortgage
$180,750
Interest Rate
6.02%
Mortgage Type
Fannie Mae Freddie Mac
Create a Home Valuation Report for This Property
The Home Valuation Report is an in-depth analysis detailing your home's value as well as a comparison with similar homes in the area
Home Values in the Area
Average Home Value in this Area
Purchase History
| Date | Buyer | Sale Price | Title Company |
|---|---|---|---|
| Scharkowski Andre | -- | None Listed On Document | |
| Scharkowski Andre | $312,000 | Commonwealth L | |
| Gamache Adrien E | -- | Chicago Title | |
| Gamache Adrien E | $225,990 | Chicago Title |
Source: Public Records
Mortgage History
| Date | Status | Borrower | Loan Amount |
|---|---|---|---|
| Previous Owner | Gamache Adrien E | $180,750 | |
| Closed | Gamache Adrien E | $45,198 |
Source: Public Records
Tax History Compared to Growth
Tax History
| Year | Tax Paid | Tax Assessment Tax Assessment Total Assessment is a certain percentage of the fair market value that is determined by local assessors to be the total taxable value of land and additions on the property. | Land | Improvement |
|---|---|---|---|---|
| 2024 | $3,301 | $448,000 | $68,300 | $379,700 |
| 2023 | $3,250 | $541,000 | $68,300 | $472,700 |
| 2022 | $3,273 | $457,000 | $65,900 | $391,100 |
| 2021 | $3,308 | $397,000 | $65,900 | $331,100 |
| 2020 | $3,674 | $372,000 | $65,900 | $306,100 |
| 2018 | $2,881 | $378,000 | $63,500 | $314,500 |
| 2017 | $2,184 | $312,000 | $61,900 | $250,100 |
| 2016 | $1,901 | $249,000 | $59,500 | $189,500 |
| 2015 | $1,876 | $215,000 | $56,500 | $158,500 |
| 2014 | -- | $210,000 | $54,500 | $155,500 |
| 2013 | -- | $150,000 | $49,500 | $100,500 |
Source: Public Records
Map
Nearby Homes
- 13001 40th Ave S
- 13055 33rd Ave S
- 13558 37th Ave S Unit 22
- 13550 37th Ave S Unit C37
- 13348 32nd Ave S
- 13633 42nd Ave S
- 700 S 124th St
- 13041 33rd Ave S
- 14423 26th Ct S Unit Lot 2
- 4504 S 124th St
- 4627 S 125th St
- 2608 S 133rd St
- 13718 Macadam Rd S
- 0 Lot 4 S 125th Place
- 13827 Macadam Rd S
- 14003 Macadam Rd S
- 13307 24th Ave S
- 12630 24th Ave S
- 12647 24th Ave S
- 2311 S 135th Ln
- 13021 38th Ln S Unit G9
- 13021 38th Ln S Unit A14
- 13021 38th Ln S Unit G4
- 13021 38th Ln S Unit G5
- 13021 38th Ln S Unit C2
- 13021 38th Ln S Unit A17
- 13021 38th Ln S Unit J10
- 13021 38th Ln S Unit E14
- 13021 38th Ln S Unit E7
- 13021 38th Ln S Unit A4
- 13021 38th Ln S Unit G6
- 13021 38th Ln S Unit A18
- 13021 38th Ln S Unit H16
- 13021 38th Ln S Unit J3
- 13021 38th Ln S Unit K1
- 13021 38th Ln S Unit H8
- 13021 38th Ln S Unit D7
- 13021 38th Ln S Unit H10
- 13021 38th Ln S Unit B8
- 13021 38th Ln S Unit E15