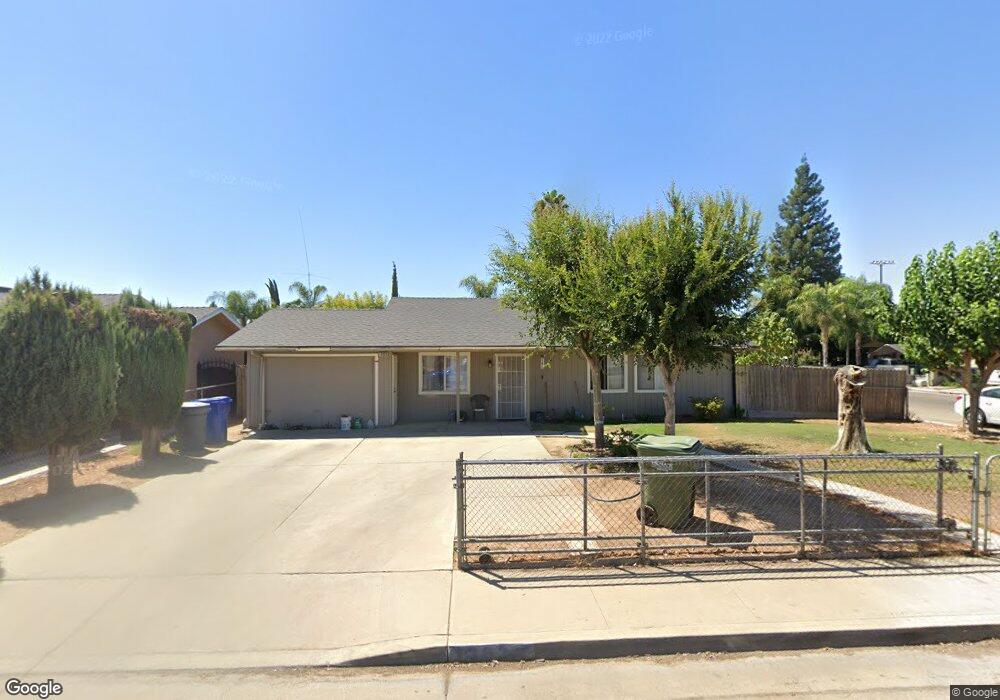
13029 Quinto Ct Unit 2 Cutler, CA 93615
Estimated Value: $243,000 - $330,000
3
Beds
3
Baths
1,110
Sq Ft
$262/Sq Ft
Est. Value
About This Home
This home is located at 13029 Quinto Ct Unit 2, Cutler, CA 93615 and is currently estimated at $290,739, approximately $261 per square foot. 13029 Quinto Ct Unit 2 is a home located in Tulare County with nearby schools including Cutler Elementary School, El Monte Middle School, and Orosi High School.
Ownership History
Date
Name
Owned For
Owner Type
Purchase Details
Closed on
Sep 30, 2016
Sold by
Larco Ana Ruth
Bought by
Larco Ana Ruth
Current Estimated Value
Home Financials for this Owner
Home Financials are based on the most recent Mortgage that was taken out on this home.
Original Mortgage
$108,600
Outstanding Balance
$50,861
Interest Rate
3.44%
Mortgage Type
New Conventional
Estimated Equity
$239,878
Purchase Details
Closed on
Nov 22, 2006
Sold by
Enamorado Ana
Bought by
Enamorado Ana
Home Financials for this Owner
Home Financials are based on the most recent Mortgage that was taken out on this home.
Original Mortgage
$124,600
Interest Rate
6.37%
Mortgage Type
New Conventional
Purchase Details
Closed on
Oct 1, 2004
Sold by
Alvarez Gerardo
Bought by
Enamorado Ana
Home Financials for this Owner
Home Financials are based on the most recent Mortgage that was taken out on this home.
Original Mortgage
$95,000
Interest Rate
6.5%
Mortgage Type
Purchase Money Mortgage
Create a Home Valuation Report for This Property
The Home Valuation Report is an in-depth analysis detailing your home's value as well as a comparison with similar homes in the area
Home Values in the Area
Average Home Value in this Area
Purchase History
We collect this data history from publicly available records. To have your information removed, we recommend requesting removal directly through your county’s website.
| Date | Buyer | Sale Price | Title Company |
|---|---|---|---|
| Larco Ana Ruth | -- | First American Title Ins Co | |
| Enamorado Ana | -- | None Available | |
| Enamorado Ana | $115,000 | Chicago Title Co |
Source: Public Records
Mortgage History
We collect this data history from publicly available records. To have your information removed, we recommend requesting removal directly through your county’s website.
| Date | Status | Borrower | Loan Amount |
|---|---|---|---|
| Open | Larco Ana Ruth | $108,600 | |
| Closed | Enamorado Ana | $124,600 | |
| Closed | Enamorado Ana | $95,000 |
Source: Public Records
Tax History
| Year | Tax Paid | Tax Assessment Tax Assessment Total Assessment is a certain percentage of the fair market value that is determined by local assessors to be the total taxable value of land and additions on the property. | Land | Improvement |
|---|---|---|---|---|
| 2025 | $1,680 | $160,301 | $41,818 | $118,483 |
| 2024 | $1,680 | $157,159 | $40,999 | $116,160 |
| 2023 | $1,651 | $154,079 | $40,196 | $113,883 |
| 2022 | $1,596 | $151,058 | $39,408 | $111,650 |
| 2021 | $1,577 | $148,096 | $38,635 | $109,461 |
| 2020 | $1,546 | $146,578 | $38,239 | $108,339 |
| 2019 | $1,566 | $143,704 | $37,489 | $106,215 |
| 2018 | $1,554 | $140,886 | $36,754 | $104,132 |
| 2017 | $1,389 | $123,000 | $31,000 | $92,000 |
| 2016 | $1,201 | $109,000 | $27,000 | $82,000 |
| 2015 | $795 | $88,000 | $22,000 | $66,000 |
| 2014 | $795 | $81,000 | $20,000 | $61,000 |
Source: Public Records
Map
Nearby Homes
- 12917 Avenue 404
- 12561 Aceves Ave
- 12414 Edward Ave
- 13200 Avenue 414
- 12500 Avenue 419
- 41640 Road 120
- 0 Road 140
- 11012 Avenue 412
- 000 140 Rd
- 39088 Road 104
- 0 Madera St Unit 234235
- Drive 152nd
- 0 Avenue 381
- 10027 Avenue 424
- 41493 Road 96
- 10175 S Anchor Ave
- 15725 Avenue 376th
- 36705 Road 144
- 36713 Road 144
- 1942 E Olive Way
- 13039 Quinto Ct
- 13030 Virgil Ave
- 13040 Virgil Ave
- 13049 Quinto Ct
- 40565 Johnston Rd
- 13028 Quinto Ct
- 40573 Johnston Rd
- 40557 Johnston Rd
- 13050 Virgil Ave Unit 2
- 13038 Quinto Ct
- 40583 Johnston Rd
- 13059 Quinto Ct
- 40547 Johnston Rd
- 13048 Quinto Ct
- 13060 Virgil Ave
- 40591 Johnston Rd
- 40539 Johnston Rd
- 13058 Quinto Ct
- 13031 Virgil Ave
- 13041 Virgil Ave
Your Personal Tour Guide
Ask me questions while you tour the home.