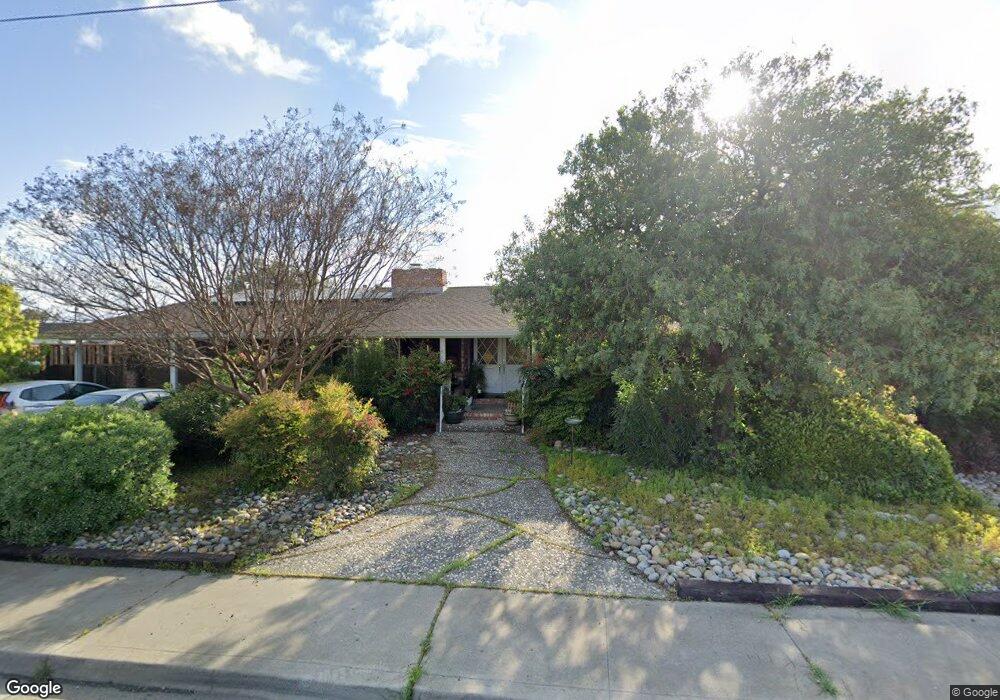
1303 B St Antioch, CA 94509
North Antioch NeighborhoodEstimated Value: $529,000 - $633,000
3
Beds
3
Baths
1,974
Sq Ft
$299/Sq Ft
Est. Value
About This Home
This home is located at 1303 B St, Antioch, CA 94509 and is currently estimated at $589,835, approximately $298 per square foot. 1303 B St is a home located in Contra Costa County with nearby schools including Fremont Elementary School, Antioch Middle School, and Antioch High School.
Ownership History
Date
Name
Owned For
Owner Type
Purchase Details
Closed on
Oct 6, 2014
Sold by
Grimes Erin S
Bought by
Lemberger Philip James
Current Estimated Value
Home Financials for this Owner
Home Financials are based on the most recent Mortgage that was taken out on this home.
Original Mortgage
$173,000
Outstanding Balance
$132,532
Interest Rate
4.08%
Mortgage Type
New Conventional
Estimated Equity
$457,303
Purchase Details
Closed on
Dec 2, 2002
Sold by
Ebel Iris D
Bought by
Ebel Iris D
Purchase Details
Closed on
Sep 23, 1995
Sold by
Ebel Leonard Sam and Ebel Iris D
Bought by
Reyes Ernesto T and Reyes Shannon
Home Financials for this Owner
Home Financials are based on the most recent Mortgage that was taken out on this home.
Original Mortgage
$100,000
Interest Rate
7.88%
Mortgage Type
Seller Take Back
Create a Home Valuation Report for This Property
The Home Valuation Report is an in-depth analysis detailing your home's value as well as a comparison with similar homes in the area
Home Values in the Area
Average Home Value in this Area
Purchase History
| Date | Buyer | Sale Price | Title Company |
|---|---|---|---|
| Lemberger Philip James | $267,000 | First American Title Company | |
| Ebel Iris D | -- | -- | |
| Reyes Ernesto T | $100,000 | -- |
Source: Public Records
Mortgage History
| Date | Status | Borrower | Loan Amount |
|---|---|---|---|
| Open | Lemberger Philip James | $173,000 | |
| Previous Owner | Reyes Ernesto T | $100,000 |
Source: Public Records
Tax History
| Year | Tax Paid | Tax Assessment Tax Assessment Total Assessment is a certain percentage of the fair market value that is determined by local assessors to be the total taxable value of land and additions on the property. | Land | Improvement |
|---|---|---|---|---|
| 2025 | $4,164 | $320,885 | $144,218 | $176,667 |
| 2024 | $3,950 | $314,594 | $141,391 | $173,203 |
| 2023 | $3,950 | $308,426 | $138,619 | $169,807 |
| 2022 | $3,891 | $302,379 | $135,901 | $166,478 |
| 2021 | $3,738 | $296,451 | $133,237 | $163,214 |
| 2019 | $3,691 | $287,660 | $129,286 | $158,374 |
| 2018 | $3,562 | $282,020 | $126,751 | $155,269 |
| 2017 | $3,472 | $276,491 | $124,266 | $152,225 |
| 2016 | $3,393 | $271,071 | $121,830 | $149,241 |
| 2015 | $3,363 | $267,000 | $120,000 | $147,000 |
| 2014 | $1,264 | $89,618 | $23,167 | $66,451 |
Source: Public Records
Map
Nearby Homes
Your Personal Tour Guide
Ask me questions while you tour the home.