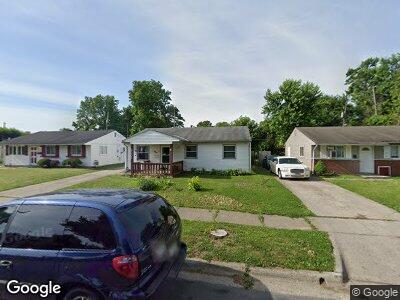
1303 Coe Dr Columbus, OH 43207
Marion Franklin NeighborhoodEstimated Value: $139,000 - $161,221
3
Beds
1
Bath
1,090
Sq Ft
$139/Sq Ft
Est. Value
About This Home
This home is located at 1303 Coe Dr, Columbus, OH 43207 and is currently estimated at $151,055, approximately $138 per square foot. 1303 Coe Dr is a home located in Franklin County with nearby schools including Watkins Elementary School, Buckeye Middle School, and Marion-Franklin High School.
Ownership History
Date
Name
Owned For
Owner Type
Purchase Details
Closed on
Apr 20, 2000
Sold by
Hud
Bought by
National Home Foundation Inc
Current Estimated Value
Home Financials for this Owner
Home Financials are based on the most recent Mortgage that was taken out on this home.
Original Mortgage
$1,620
Interest Rate
8.24%
Mortgage Type
Stand Alone Second
Purchase Details
Closed on
Apr 21, 1999
Sold by
National Home Foundations Inc
Bought by
Caudy Debra K
Home Financials for this Owner
Home Financials are based on the most recent Mortgage that was taken out on this home.
Original Mortgage
$52,350
Interest Rate
8.24%
Purchase Details
Closed on
Nov 15, 1996
Sold by
Cousins Felicia R and Nationsbanc Mtg Corp
Bought by
Hud
Purchase Details
Closed on
Nov 16, 1993
Bought by
Cousins Felicia R
Purchase Details
Closed on
Jul 1, 1984
Purchase Details
Closed on
May 1, 1984
Create a Home Valuation Report for This Property
The Home Valuation Report is an in-depth analysis detailing your home's value as well as a comparison with similar homes in the area
Home Values in the Area
Average Home Value in this Area
Purchase History
| Date | Buyer | Sale Price | Title Company |
|---|---|---|---|
| National Home Foundation Inc | $25,000 | -- | |
| Caudy Debra K | $54,000 | -- | |
| Hud | $35,000 | -- | |
| Cousins Felicia R | $40,900 | -- | |
| -- | $31,000 | -- | |
| -- | $15,500 | -- |
Source: Public Records
Mortgage History
| Date | Status | Borrower | Loan Amount |
|---|---|---|---|
| Open | Caudy-Woods Debra | $75,000 | |
| Closed | Caudy Debra K | $89,000 | |
| Closed | Caudy Debra K | $1,620 | |
| Previous Owner | Caudy Debra K | $52,350 |
Source: Public Records
Tax History Compared to Growth
Tax History
| Year | Tax Paid | Tax Assessment Tax Assessment Total Assessment is a certain percentage of the fair market value that is determined by local assessors to be the total taxable value of land and additions on the property. | Land | Improvement |
|---|---|---|---|---|
| 2024 | $2,044 | $45,540 | $14,390 | $31,150 |
| 2023 | $2,018 | $45,535 | $14,385 | $31,150 |
| 2022 | $1,024 | $19,740 | $8,960 | $10,780 |
| 2021 | $1,026 | $19,740 | $8,960 | $10,780 |
| 2020 | $1,027 | $19,740 | $8,960 | $10,780 |
| 2019 | $1,000 | $16,490 | $7,770 | $8,720 |
| 2018 | $1,099 | $16,490 | $7,770 | $8,720 |
| 2017 | $1,161 | $16,490 | $7,770 | $8,720 |
| 2016 | $1,322 | $19,960 | $3,120 | $16,840 |
| 2015 | $1,200 | $19,960 | $3,120 | $16,840 |
| 2014 | $1,203 | $19,960 | $3,120 | $16,840 |
| 2013 | $624 | $21,000 | $3,290 | $17,710 |
Source: Public Records
Map
Nearby Homes
- 1305 Yolanda Dr
- 1325 Evergreen Rd
- 1364 Wick Ct
- 1621 Burley Dr
- 2882 Fairwood Ave
- 3037 Southfield Dr
- 757 Lawndale Ave
- 3087 Woodway Rd
- 1336 Southfield Dr S
- 1146 Lawrence Dr
- 1292 Moundview Ave
- 3199 Fairwood Ave
- 1565 Southfield Dr S
- 1325 Smith Rd
- 0 Elwood Ave Unit Lot 108 225014603
- 0 Elwood Ave Unit Lot 8 225014595
- 572 Elwood Ave Unit Lot 113
- 0 Elwood Ave Unit Lot 9 225014592
- 1327 Eldorn Dr
- 1920 S Champion Ave