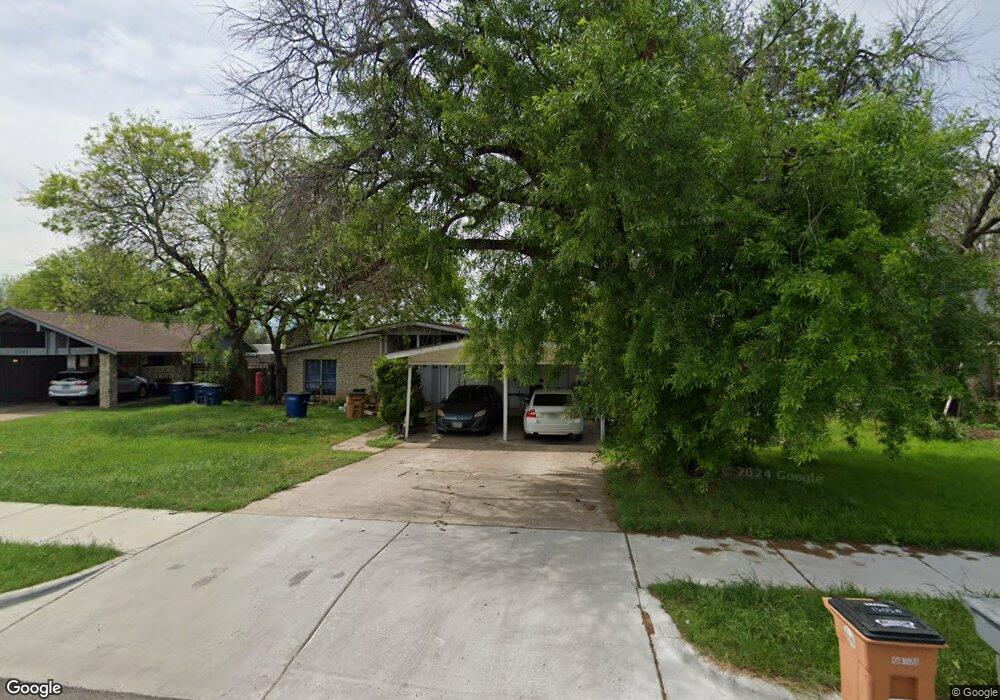
1303 Fairbanks Dr Unit A Austin, TX 78752
Saint Johns NeighborhoodEstimated Value: $496,105 - $535,000
3
Beds
1
Bath
2,244
Sq Ft
$233/Sq Ft
Est. Value
About This Home
This home is located at 1303 Fairbanks Dr Unit A, Austin, TX 78752 and is currently estimated at $523,026, approximately $233 per square foot. 1303 Fairbanks Dr Unit A is a home located in Travis County with nearby schools including Pickle Elementary School, Webb Middle School, and Northeast Early College High School (Formerly Reagan High School).
Ownership History
Date
Name
Owned For
Owner Type
Purchase Details
Closed on
Apr 15, 2020
Sold by
Alegria Elizabeth Junko and Alegria Elizabeth J
Bought by
Alegria Richard Samson and Alegria Elizabeth Junko
Current Estimated Value
Purchase Details
Closed on
Jul 25, 2007
Sold by
Romo Landry Shawn C and Romo Landry Monica
Bought by
Alegria Elizabeth J
Home Financials for this Owner
Home Financials are based on the most recent Mortgage that was taken out on this home.
Original Mortgage
$150,400
Outstanding Balance
$95,128
Interest Rate
6.73%
Mortgage Type
Purchase Money Mortgage
Estimated Equity
$427,898
Purchase Details
Closed on
May 24, 2006
Sold by
Oconnell Arthur J
Bought by
Romo Landry Shawn C and Romo Landry Monica
Home Financials for this Owner
Home Financials are based on the most recent Mortgage that was taken out on this home.
Original Mortgage
$122,479
Interest Rate
6.5%
Mortgage Type
Purchase Money Mortgage
Create a Home Valuation Report for This Property
The Home Valuation Report is an in-depth analysis detailing your home's value as well as a comparison with similar homes in the area
Home Values in the Area
Average Home Value in this Area
Purchase History
| Date | Buyer | Sale Price | Title Company |
|---|---|---|---|
| Alegria Richard Samson | -- | None Available | |
| Alegria Elizabeth J | -- | Austin Title Company | |
| Romo Landry Shawn C | -- | Alamo Title Company |
Source: Public Records
Mortgage History
| Date | Status | Borrower | Loan Amount |
|---|---|---|---|
| Open | Alegria Elizabeth J | $150,400 | |
| Previous Owner | Romo Landry Shawn C | $122,479 |
Source: Public Records
Tax History Compared to Growth
Tax History
| Year | Tax Paid | Tax Assessment Tax Assessment Total Assessment is a certain percentage of the fair market value that is determined by local assessors to be the total taxable value of land and additions on the property. | Land | Improvement |
|---|---|---|---|---|
| 2025 | $9,472 | $441,695 | $256,097 | $185,598 |
| 2023 | $9,140 | $505,171 | $275,000 | $230,171 |
| 2022 | $10,004 | $506,560 | $275,000 | $231,560 |
| 2021 | $6,795 | $312,161 | $100,000 | $212,161 |
| 2020 | $5,244 | $244,500 | $100,000 | $144,500 |
| 2019 | $5,671 | $244,800 | $100,000 | $144,800 |
| 2018 | $5,729 | $258,770 | $100,000 | $158,770 |
| 2017 | $5,362 | $240,416 | $100,000 | $140,416 |
| 2016 | $5,093 | $228,392 | $50,000 | $178,392 |
| 2015 | $4,308 | $185,635 | $50,000 | $135,635 |
| 2014 | $4,308 | $181,035 | $50,000 | $131,035 |
Source: Public Records
Map
Nearby Homes
- 1306 E Saint Johns Ave
- 1207 Radcliff Dr
- 1307 E Saint Johns Ave Unit B
- 7305 A/B Grand Canyon Dr
- 6910 Blessing Ave
- 6908 -6910 Blessing Ave
- 6908 Blessing Ave
- 7309 Blessing Ave
- 7305 Berkman Dr
- 7008 Meador Ave Unit 1
- 7402 Sevilla Dr
- 7503 Berkman Dr
- 7312 Meador Ave
- 7510 Sevilla Dr
- 6912 Meador Ave
- 7209 Coronado Cir
- 7205 Bethune Ave
- 7209 Bethune Ave
- 7105 Bethune Ave
- 7602 Blessing Ave
- 1303 Fairbanks Dr Unit B
- 1303 Fairbanks Dr
- 1301 Fairbanks Dr
- 1305 Fairbanks Dr
- 1305 Fairbanks Dr Unit B
- 1305 Fairbanks Dr Unit A & B
- 1305 Fairbanks Dr Unit A
- 1210 Radcliff Dr
- 1208 Radcliff Dr
- 1209 Fairbanks Dr
- 1300 Radcliff Dr
- 1300 Radcliff Dr Unit A
- 1307 Fairbanks Dr Unit B
- 1307 Fairbanks Dr
- 1307 Fairbanks Dr Unit A
- 1206 Radcliff Dr
- 1302 Fairbanks Dr
- 1302 Fairbanks Dr Unit B
- 1302 Fairbanks Dr Unit A
- 1300 Fairbanks Dr