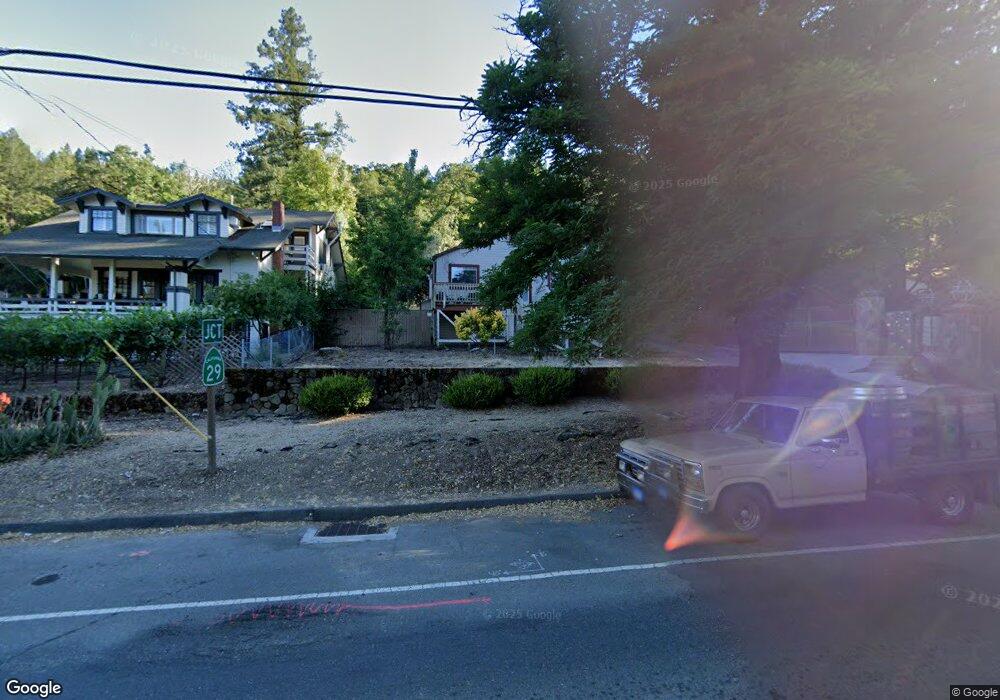
1303 Foothill Blvd Calistoga, CA 94515
Estimated Value: $611,000 - $911,000
2
Beds
1
Bath
700
Sq Ft
$1,035/Sq Ft
Est. Value
About This Home
This home is located at 1303 Foothill Blvd, Calistoga, CA 94515 and is currently estimated at $724,556, approximately $1,035 per square foot. 1303 Foothill Blvd is a home located in Napa County with nearby schools including Calistoga Elementary School and Calistoga Junior/Senior High School.
Ownership History
Date
Name
Owned For
Owner Type
Purchase Details
Closed on
Aug 13, 2014
Sold by
P B Hein Installations Inc
Bought by
Kite Nicholas J and Kite Gillian M
Current Estimated Value
Home Financials for this Owner
Home Financials are based on the most recent Mortgage that was taken out on this home.
Original Mortgage
$252,000
Outstanding Balance
$192,221
Interest Rate
4.12%
Mortgage Type
New Conventional
Estimated Equity
$532,335
Purchase Details
Closed on
Apr 15, 2014
Sold by
Stevens Mike and Stevens Rebecca R
Bought by
Pb Hein Installation Inc and R&A Napa Properties Inc
Purchase Details
Closed on
Jan 5, 1994
Sold by
Frediani Steven M and Frediani Alfred A
Bought by
Stevens Mike and Stevens Rebecca R
Home Financials for this Owner
Home Financials are based on the most recent Mortgage that was taken out on this home.
Original Mortgage
$116,350
Interest Rate
6.8%
Create a Home Valuation Report for This Property
The Home Valuation Report is an in-depth analysis detailing your home's value as well as a comparison with similar homes in the area
Home Values in the Area
Average Home Value in this Area
Purchase History
| Date | Buyer | Sale Price | Title Company |
|---|---|---|---|
| Kite Nicholas J | $315,000 | First American Title Company | |
| Pb Hein Installation Inc | $110,439 | None Available | |
| Stevens Mike | $150,000 | First American Title |
Source: Public Records
Mortgage History
| Date | Status | Borrower | Loan Amount |
|---|---|---|---|
| Open | Kite Nicholas J | $252,000 | |
| Previous Owner | Stevens Mike | $116,350 |
Source: Public Records
Tax History Compared to Growth
Tax History
| Year | Tax Paid | Tax Assessment Tax Assessment Total Assessment is a certain percentage of the fair market value that is determined by local assessors to be the total taxable value of land and additions on the property. | Land | Improvement |
|---|---|---|---|---|
| 2025 | $4,093 | $378,573 | $240,367 | $138,206 |
| 2024 | $4,093 | $371,151 | $235,654 | $135,497 |
| 2023 | $4,093 | $363,875 | $231,034 | $132,841 |
| 2022 | $3,839 | $356,741 | $226,504 | $130,237 |
| 2021 | $3,720 | $349,747 | $222,063 | $127,684 |
| 2020 | $3,678 | $346,162 | $219,787 | $126,375 |
| 2019 | $3,631 | $339,376 | $215,478 | $123,898 |
| 2018 | $3,585 | $332,722 | $211,253 | $121,469 |
| 2017 | $3,512 | $326,199 | $207,111 | $119,088 |
| 2016 | $3,418 | $319,803 | $203,050 | $116,753 |
| 2015 | $3,379 | $315,000 | $200,000 | $115,000 |
| 2014 | $1,984 | $183,005 | $124,777 | $58,228 |
Source: Public Records
Map
Nearby Homes
- 1423 Foothill Blvd
- 1510 Foothill Blvd
- 18276 California 128 Unit A
- 1607 Foothill Blvd
- 1610 Myrtle St
- 3027 Foothill Blvd
- 3567 California 128
- 1619 Foothill Blvd
- 511 Kortum Canyon Rd
- 1722 Foothill Blvd
- 800 Washington St
- 1411 4th St
- 1431 4th St
- 375 Kortum Canyon Rd
- 1437 4th St
- 304 High St
- 1422 N Oak St
- 1438 Grant St
- 1557 Silverado Terrace Loop
- 1551 Silverado Terrace Loop
- 1213 Foothill Blvd
- 1305 Foothill Blvd
- 0 California 128
- 12139 California 128
- 1304 Foothill Blvd
- 1313 Foothill Blvd
- 1207 Foothill Blvd
- 1302 Foothill Blvd
- 1306 Foothill Blvd
- 1308 Foothill Blvd
- 1104 Elm St
- 1106 Elm St
- 1117 Lincoln Ave
- 1323 Foothill Blvd
- 1125 Lincoln Ave
- 1109 Elm St
- 1305 Myrtle St
- 1102 Spring St
- 1311 Myrtle St
- 1101 Foothill Blvd Unit 1-7